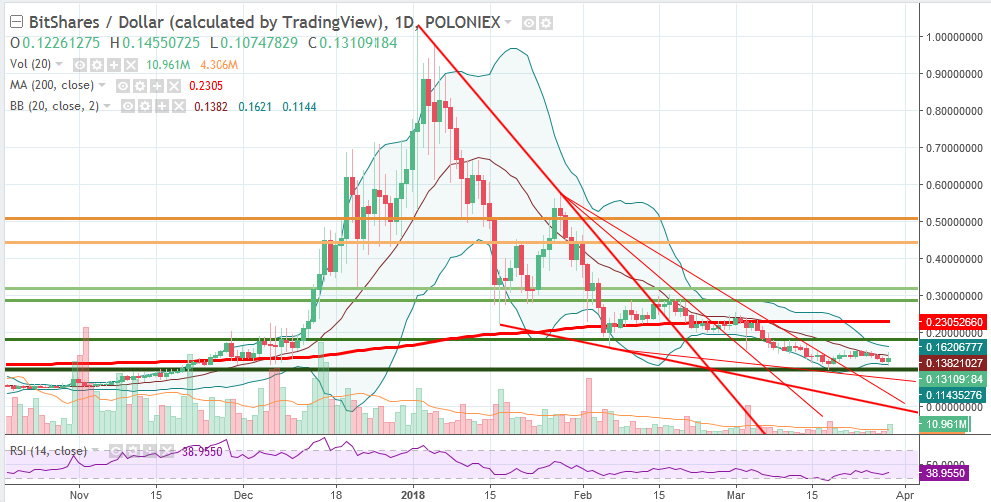
The chart I’m watching is BTS
Come on everyone. Comment on the chart, and the other indicators, patterns, and the like that you’re using and tell us what you see. I know lots of you have been following me for a long time now so take a close look and tell us what you think from the technical analysis perspective. Nothing to bet the farm on, no holy grails, just another small aspect of investing and trading. And it's fun too.
Great TA websites:
http://stockcharts.com/school/doku.php?id=chart_school
https://www.investopedia.com/university/technical/
https://en.wikipedia.org/wiki/Technical_analysis
https://www.tradingview.com/ideas/technicalanalysis/
There are others. Feel free to post your favorites.
Read the "The Dos and Don’ts" here if you're not aware of my rules.
I can see the Bollinger Bands are getting squeezed, this could mean price break either to the upside or hopefully not the downside. We are basically above very significant long therm support. Volume is getting lower as well and clearly we are below 200 MA. We are still in the downtrend and with the overall crypto weakness, I think we will still stay in this range for a few months. This gives us an opportunity to add to our portfolio. Manny people say “when this dip comes, I will be buying like crazy”. Instead most people are selling or staying on the sidelines. I think it’s a mistake. We may never have this kind of opportunity in our lifetime anymore.
I think I pretty much agree with the multi-month range and that BTS may have found support. As I see it, volume is exactly as you say, and that's good to see after an extended sell-off. The BBs are what I like most about what you said: when they contract, there's often a breakout, and the nice pop on volume that we saw earlier, while the rest of crypto continued to tank, shows us some real nice relative strength.
@cryptographic - Sir, I'm not a technical woman, but after reading your articles I understood few indicators that you are using with your price predictions...
In this post you used Bollinger Band indicator along with Relative Strength Index & Volume Based Indicators... Sir I think I found the meaning of your combined usage of these indicators as follows...
To determine breakout direction we can use these 3 indicators...
If there is a positive divergence – that is, if indicators are heading upward while price is heading down or neutral – it is a bullish sign. For further confirmation, look for volume to build on up days. On the other hand, if price is moving higher but the indicators are showing negative divergence, look for a downside breakout, especially if there have been increasing volume spikes on down days.https://www.investopedia.com/articles/technical/04/030304.asp
Sir, now I understood one of your professional analysis methodology & I'm predicting BTS is ready to a bull trend...
If indicators are heading upward while price is heading down or neutral – it is a bullish sign.
Thank you Sir... Glad I found a genius trader & teacher like you do...
+W+
In this case we didn't get a lower low, but we are getting positive confirmation from the indicators on the higher low, which is also a good thing. Volume has also picked up noteably on the up days. Looking a-ok for now.
@cryptographic,
Bollinger Bands (BB) I am learning about this indicator, but so far I didn't get a clear picture of it when it comes to the narrow end! In this graph I could see a Narrow end of Bollinger Band (BB) and I feel it says huge price fluctuation can not be happened in this situation!
I don't know whether I am correct or wrong! If I am wrong please correct me! But I think crypto prices has another influence that we can cater by 1 WEEK graph!
It's seasonal trends! I think Feb - June is not a good time frame for cryptos! It also mean we must collect more and hold our crypto investments in this time frame! Then it begins the cycle of rising! This is my 2-4 years crypto experience! So, I believe not only BTS, STEEM also at a good depth of price and BULL trend is about to happen! (RSI indicator is saying the same thing)
Therefore, if we buy those coins at this depth, I think we made a nice investment and we can take our seeds out in December of 2018!
Cheers~
The narrowing of the BBs indicates a drop in volatility/average daily range of price movement, but it does not forecast what might happen - it only indicates what has been happening. You can then put probabilities on a continuation of the same vs a breakout. When the bands get very narrow, people start watching closely for a possible break, which, if it's going to be to the upside, getting above the mid-band is the first goal along the way. Seasonality is favorable from here into June, so don't be too surprised to see some upside action in the near term.
Yes, the weekly is also telling. RSI still above 40, which is good for BTS.
@cryptographic,
Thank you very much, your reply cleared a lot of doubts that I had about BBs! I used this indicator in Binary Option, but I failed to understand the narrow ends! Now I think I got the point! Thank you again!
Cheers~
BitShares is a really good HODL or even strong BUY asset from now on. The breakout of the steep downtrend happened recently. BB is coming together, which would be a great indicator for price breakout. If we break to the upside, I want to se above average volume, which we are lacking at this moment. This sideline movement builds a support and I see a lot of potential in the future for BitShares because of their concept such as enormous scalability, security, Proof of Stake a.e.
With the BBs narrowing like they are down at support after an extended downtrend, it could be setting up for a break higher and I will be watching those MAs closely too.
I see falling wedges, tightening BB and an encouraging RSI.
It's a potentially good zone to accumulate
It's worth noting that the poloniex chart may not be completely accurate because they had problems with deposits/withdrawals of bts, that made the price 10% below binance's price for a few days
I like the articles on babypips about TA
Huge wedges at that! And it could be coupled with exhaustion. Definitely a good time to accumulate. We'll see. And thanks for the link!
BITSHARES will stabilize moving sideways between the ranges of 0.14 and 0.12USD during the coming days...I don’t expect BTS to go below 0.10USD so, for me it is going to be a flat or almost flat movement...
Looks like things are going pretty much as you expected. Now it's just a waiting game.
. . . sooner or later.
This is a cleaning process of useless ICOs and non-project coins. Completely necessary. Bitshares will prevail and wait because better news will arrive while combining EOS and BTS
Hello @cryptographic,
SourceTherefore, my conclusion is this is the end of the downtrend & uptrend will initiate soon.
Extraordinary good discussion you initiated.
~@mywhale
Exactly!
What I see there is an opportunity.
If we still don't invest, then we'll definitely regret it later.
Always follow the Golden rule
And the opportunity is looking better and better every day, with the price still staying low.
Yes, and I think this is gonna be the month where it will go sky high again.
Let's wait and watch
Considering how lower everything has got lately, and the fact that Bitshares is following the same pattern as most of the other crypto, I can say that it may still go a little bit lower. There seem to be a lot of people who took the cash out of crypto in order to save themselves from this massive drop. Maybe this was a smart choice especially if they come back only to purchase more. I guess that the prices could go up anytime soon, but I also think that many people will be much more careful this time.
Yeah I think you may be right to a certain extent. Some might go lower still, but some might not. While we're seeing the likes of BTC and ETC testing recent lows, we've also seen nice pops in quality Alts that are now backtesting short term support.
Hi @cryptographic ! Thanks for sharing this graph about BTS. What do you think about the overall situation of cryptos. I personally don't understand who is selling Steem, BTS. EOS has stayed with less selling, stronger than all the rest top 20 cryptos.
Regards, @gold84
EOS has weather the storm fairly well indeed. It got a nice pop off of lows (and 78.6% Fibonacci retrace levels) and may well be holding on to those gains.
Who's selling crypto? I would say it's a combination of people who bought the top and are panicking out and those who "bought" the lows years ago whose cost basis is next to nothing. That's a combination that can take a while to wash out. Patience is the name of the game right now.
Thanks for your thoughts @cryptographic ! And yes, those 2 groups of people might be the ones selling. The ones panicking and the ones taking long term earnings.
Regards, @gold84