You are viewing a single comment's thread from:
RE: The chart I’m watching is BTS
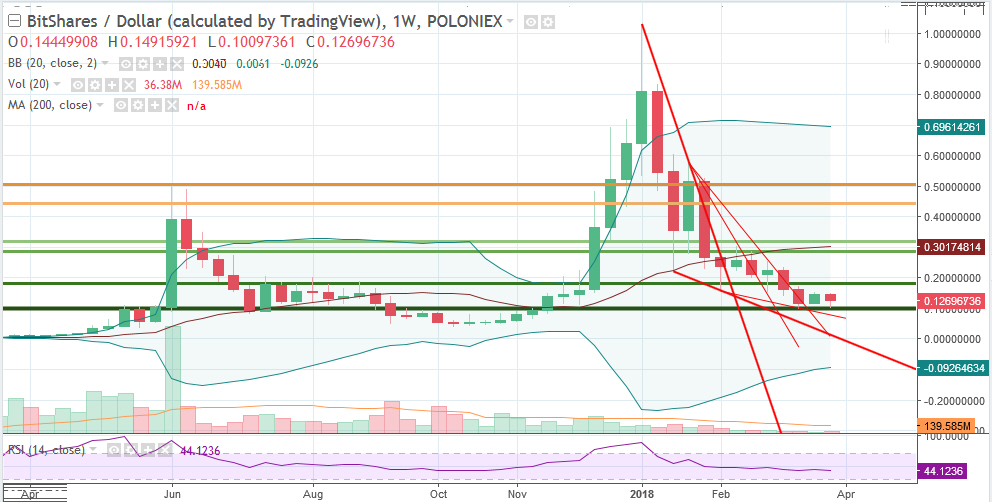
The narrowing of the BBs indicates a drop in volatility/average daily range of price movement, but it does not forecast what might happen - it only indicates what has been happening. You can then put probabilities on a continuation of the same vs a breakout. When the bands get very narrow, people start watching closely for a possible break, which, if it's going to be to the upside, getting above the mid-band is the first goal along the way. Seasonality is favorable from here into June, so don't be too surprised to see some upside action in the near term.
Yes, the weekly is also telling. RSI still above 40, which is good for BTS.
@cryptographic,
Thank you very much, your reply cleared a lot of doubts that I had about BBs! I used this indicator in Binary Option, but I failed to understand the narrow ends! Now I think I got the point! Thank you again!
Cheers~