Bitcoin Price Prediction based upon a 2000 Year Old Technique and some Common Sense
I’ve been watching the technical analysis of bitcoin and several altcoins for approximately a year now. I wouldn’t consider myself an expert on technical analysis, but I have been studying patterns for nearly half a century using other methods: one of them is astrology. A couple of weeks ago I noticed that the downward trend in bitcoin and nearly all other altcoins are once again back into a synchronized pattern.
This synchronization hasn’t always held (as if nearly all crypto’s were acting as the same entity). There was a period last fall when Bitcoin Cash and Bitcoin were on opposite trends (one down and the other up). Before that, Ethereum made a fantastic run in spring of 2017 before starting to flatten out.

source
What I noticed is that this pattern fits quite closely to what happened with the mania in fall of 2013 and subsequent drop in 2014 that lasted for nearly two years. I think many people are having a hard time coming to a conclusion that the same thing has just happened and that the following months will bear it out.
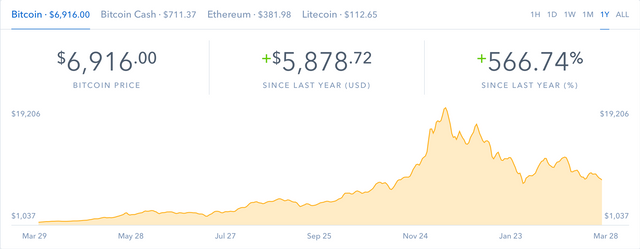
Realistically the situation isn’t the same though (last time was much worse with MtGox), but that doesn’t mean that the social pattern will reflect that. Those who bought in at $17-19K are hurting the most and many of those people have already sold out their losses. This seems to be following a pattern of first in, last out. Those who bought in at 15K, then probably sold once the support threatened to drop below that. Then the next group did the same once the support threatened to break 12.5K. And the pattern goes on. Here’s a look at the chart of the last year…
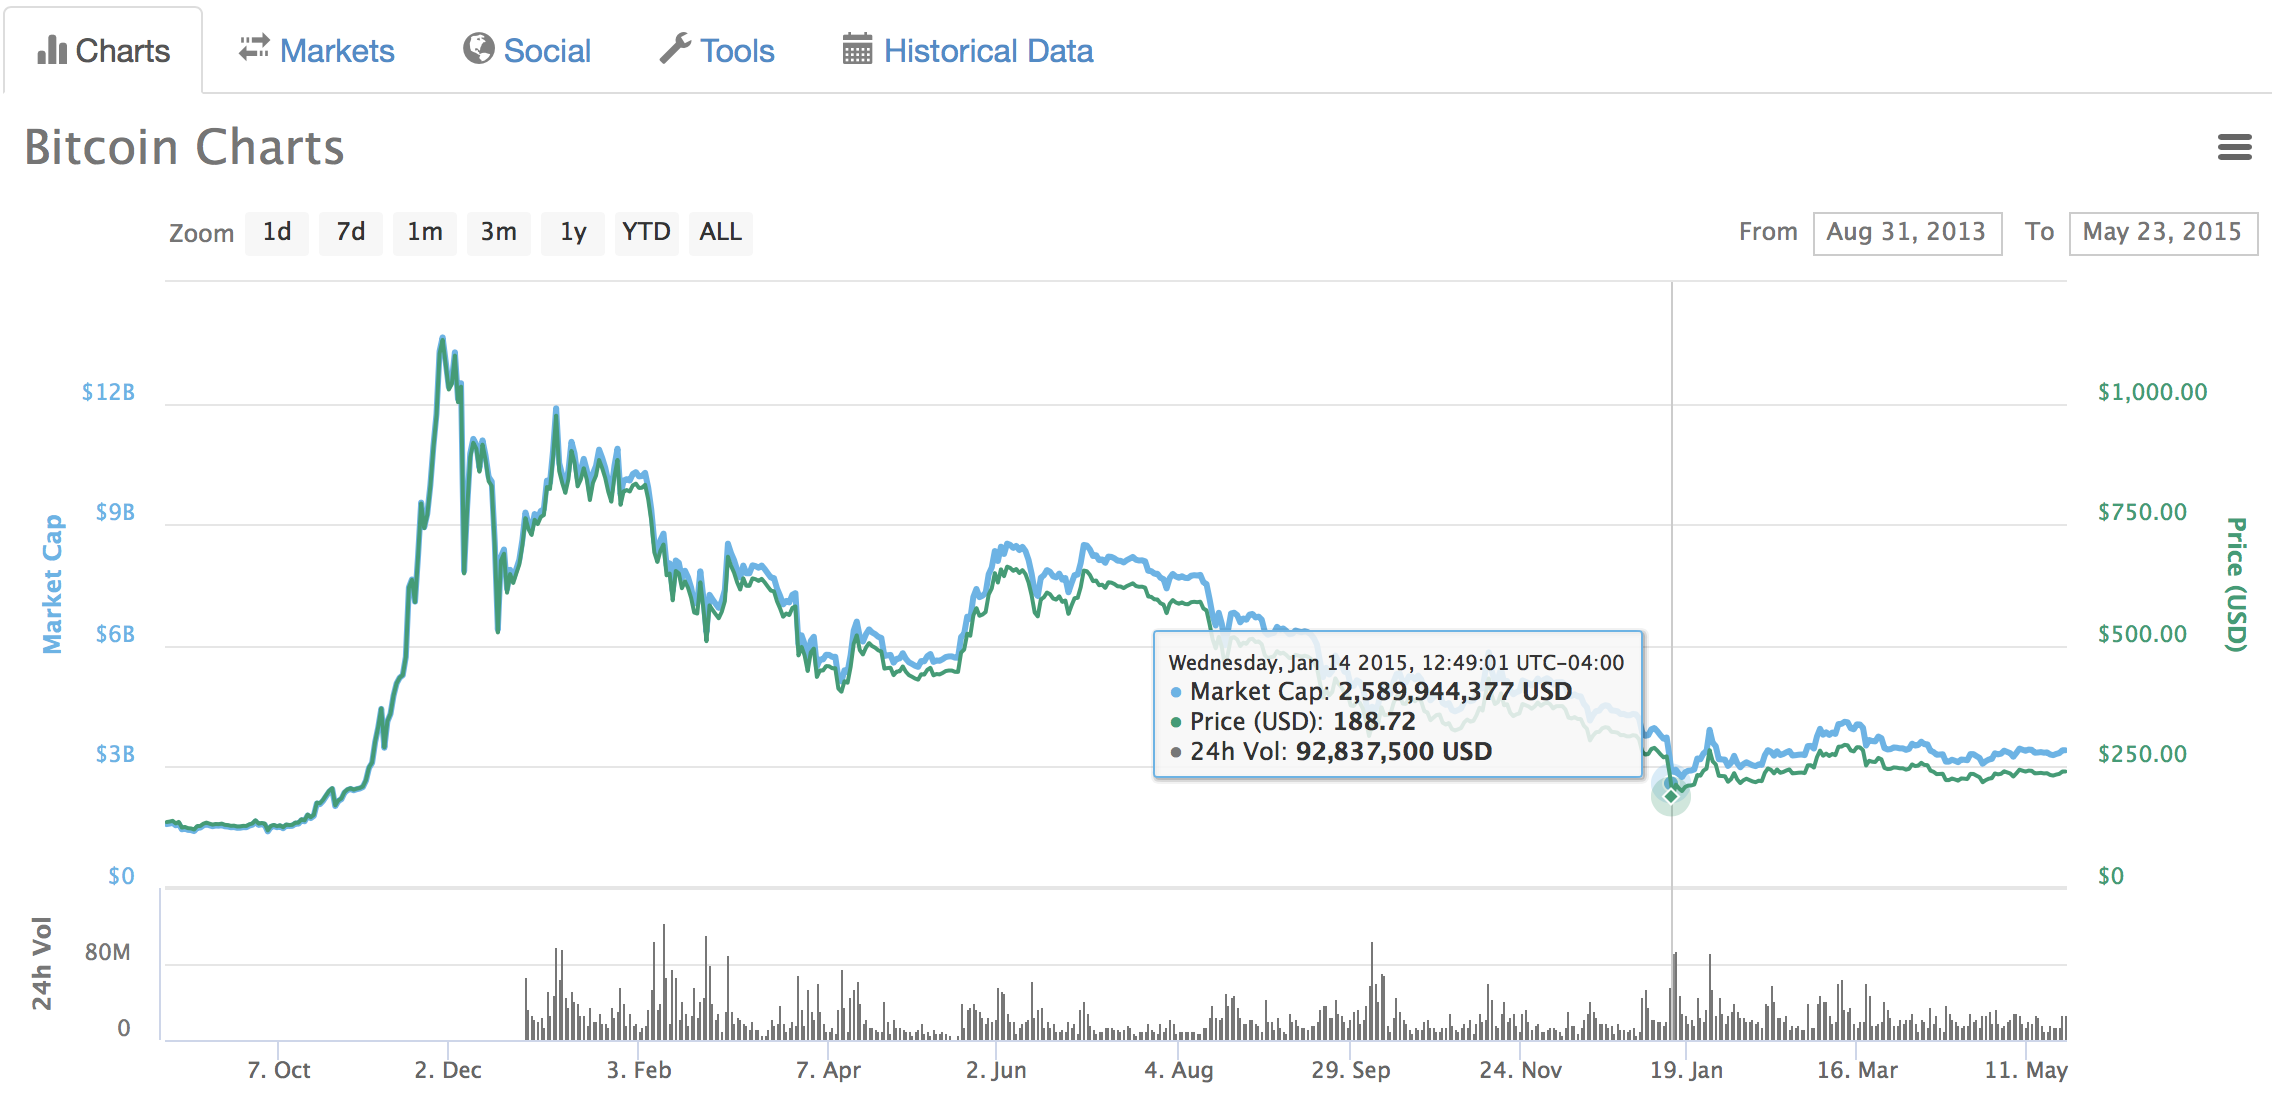
Compare the above graph to this graph below which shows the peak mania of late November 2013 with the subsequent sell off in the following months. It bottomed out in early 2015, then traded sideways for more than a year. The next upward trend coincided with the halving of the block reward in 2016 and by early 2017 bitcoin was starting to see new all time highs. Both peaks though were followed by a long term extended sell off (sharp peak and long tail).
Coincidentally, this same trend is due sometime in the summer of 2020 (halving of the block reward) which by my expectations will mark the beginning of the next major mania phase. This also coincides with Vettius Valens technique of zodiacal releasing which seems to suggest that a period of price building will take place from summer of 2020 until Feb 2021.
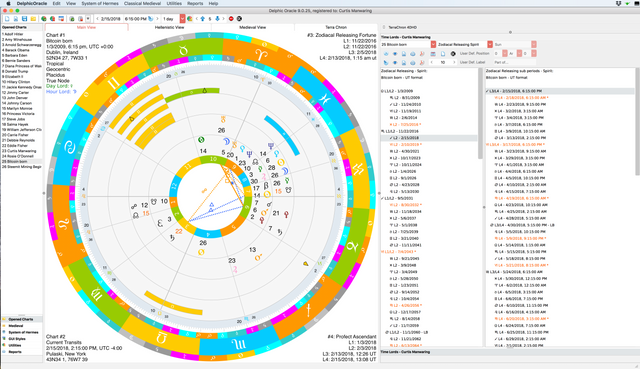
If this scale is the same as the one that happened in 2013 - 2014, what proportionate price action can we expect to bottom out at? Logically this would be making an assumption of about a 80% to 90% drop in value before we can say we are finally done with a bear market. Astrologically this period is represented by the Sagittarius 8th from fortune period in the below graphic... (I wrote this software based upon Robert Schmidt's translation work in Hellenistic Astrology).
This would suggest a lowest value of about $2500 per bitcoin around Feb - March 2019 and that it trades sideways for a little over a year after that. While some things are different this time around, the behavior seems to be largely the same.
The problem is, we aren't ready yet

source
Bitcoin is tomorrows technology. It is the future. The exact form it will take is unknown, but this technology is internet 3.0 and will cause massive infrastructure inversion to the banking and legal systems. But not today. Andreas Antonopoulos said in 2016 that Bitcoin is at about the same level of development that the internet was in 1992. So we had our mania phase late last year (an analog of 1993) when pictures would cause web browsers to crash. This is what happened to Bitcoin with the transaction fees skyrocketing and failing to scale.
Looking to the future, I'm very bullish on this technology, but near term for about a year, I'm bearish. I got in with a long term outlook and will be HODL'ing through till at least summer 2020. I was one of the lucky ones who got in when bitcoin was hovering just over $1000.
I remember one day last March 2017 (I believe it was the 24th around 9 am) looking at Coinbase and seeing a $925 price, then clicked buy, only to get it rejected because I had requested a business account which caused the buy settings to be disabled while the account was under review. That was a bad mistake and had that not happened, I'd have had 3X the amount of bitcoin now. The price never returned down to that level again and I decided against a business account there for other reasons a couple of days later.
I'm still very skeptical that this analysis will hold perfectly true. Any number of variables can change what seems to be a very predictable pattern, so don't take this as investment advice. But I will give you one piece of advice; don't hold your coins on an exchange. If you do that, they really aren't your coins. Use a hardware wallet instead (such as trezor.io).
Donations (public bitcoin address):

3FwxQsa7gmQ7c1GXJyvDTqmT6CM3mMEgcv


I think the rules have changed. Things are different now that Bitcoin hit 19k. Corporations are patenting blockchain tech and blockchain awareness is at an all time high. I'm going to be very surprised if Bitcoin goes under $4000 ever again.
I think it's unfair to compare blockchain to the internet because the problems blockchain tech can solve are much more important than what the internet did. Because cryptocurrency is the foundation of blockchain it can fund itself and send development spiraling out of control. At the same time the blockchain fully depends on the internet so it is a very strange dynamic indeed.
I definitely appreciated this post. I'm a firm believer in cyclical prediction models. Maybe I just don't want to believe that Bitcoin could go that low because I have stake in the space.
A perfect analogy doesn't teach anything.
The problem with these methods is numbers don't come attached and any one of a million things can change the trajectory. Given sameness, the expected path is like late 2013. Given differences, modifications can result. It could flash crash for 3 minutes like ETH did last June when it went to 10 cents, then return back to normal levels.
The efficient causes aren't linked to astrological events. You can hope to use the astrology as a sort of pattern analysis to detect sameness. It works sometimes due to the fact that life is non-random. It fails when emergent properties come forth.
Thank you for this analysis. It makes a great deal of sense since cycles do repeat themselves.
It will be interesting to see if the broader recognition of cryptocurrency will alter this any. The industry is much bigger than it was and there is a lot more "fundamental" movements forward.
Of course, the flip side is people are still people.
Thanks for sharing cryptocurrency update providing news.
I appreciate your post.i like Bitcoin..
Best of luck@zoidsoft(61)
Interesting article. I liked it. Good luck in your work.
Very nice crypto currency, I like it this crypto.
I appreciate your post. thanks for sharing this Post........
patterns repeat, but I think they have become more short-lived with higher media attention now. I have the feeling that there are many people just waiting for the right signs to buy in and once we see a few weeks of consistent gains we might be back to the next mania.