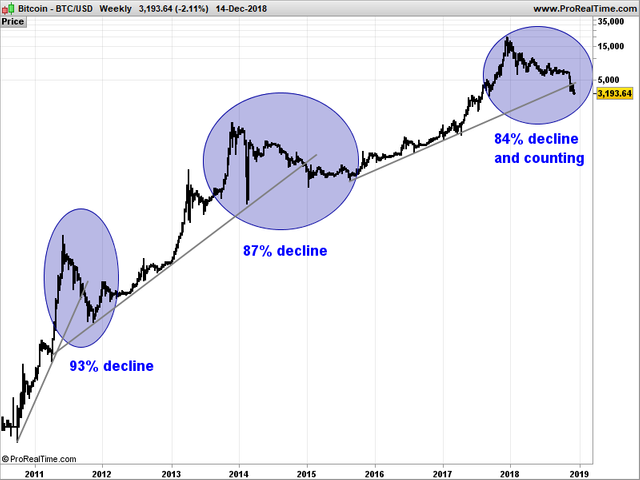
Comparing the 3 major declines
Many compare the current correction with the one in 2014. That can be useful as patterns are never equal but they can be similar. History does not repeat, it rhymes; as the saying goes.
In fact we've had 3 major declines in bitcoin's 10 year existence. You can see them in the above chart. The first major bitcoin decline occurred between June 2011 to November 2011 when it went from $31.91 to $1.99 for a 93% decline. The second one started in December 2013 and, well, I've put the bottom in January 2015 - which is a bit arbitrary, I agree. All this for a decline from $1241.92 to $157.29 which amounts to a fall of 87%. The current correction started in December 2017 at a top of $19870 and we're currently looking at a low of $3135 and an 84% loss from the highs.
So far, nothing out of the ordinary. In addition, it must be pointed out that in all 3 cases the trendlines were broken. I was personally rather worried that important long term trend lines got broken, but apparently, for bitcoin, this is business as usual.
Below, another important trend line that got convincingly broken in the last couple of weeks.

The monthly chart shows also that an inportant long term trend line has been broken, but we're going to try and ignore that. What should not be ignored is that the Stochastic RSI is very low. The last time that occurred we got the ultimate bull run of 2015 - 2017 not long there after. In addition, the Ergodic oscillator is diverging.
Zooming in to the weekly chart we can see that bitcoin is oversold on the trend line, the Stochastic RSI is low and both the MACD and Ergodic oscillator diverge. These are the reasons that make me believe a correction in the downtrend is coming.
On the daily chart the Stochastic RSI is too high, else the same.
On the 8 hour chart also divergences in the MACD and Ergodic oscillator while the Stochastic is approaching lows.
So we seem to be approaching an important low, with arguably a little bit more downside to go. This aligns nicely with the $3000-level where both resistance and support have established themselves in the past. However, if this level gets broken then we're looking at a $1750 - $1400 range for the next target. I think this is also where Tone Vays is looking at.
If we were to drop to, let's say, $1500 then we will have made a correction of 94%. That would still be within historically justifiable parameters.


Congratulations @youp! You have completed the following achievement on the Steem blockchain and have been rewarded with new badge(s) :
Click here to view your Board of Honor
If you no longer want to receive notifications, reply to this comment with the word
STOPTo support your work, I also upvoted your post!
This is a really good post of info, thanks!
I hope we don't see below 3k, although many are calling for it, so we'll see.
However longer term I think it will do extremely well again as this information seems to demonstrate.
Out of curiosity are you personally a long holder, or a more regular trader?
Thank you for your kind words. I am basically a hodler as I'm very bullish on crypto and am actually becoming more bullish as the ecosystem grows. I do try to trade around my core position, with mixed results I must admit. That's why I started to blog about it: to organise my thoughts and to try and develop useful ideas. Lately I'm thinking it may be best to simply buy and hold and add to your position on crashes like we have now. Should we go down further, buy more. It is difficult enough to pinpoint a bottom, or near a bottom. It is equally difficult to label a top. Consequently, entering and exiting is not going to make you rich. Despite the fact that you can occasionally make an good run.
Very similar to me actually!
I’ve tried small, quicker trading here and there with little gain. Trying to either gain a bigger core or cash in, i bought a lot at recent lows and have my fave Alts I think when the time comes will reap me great gains.
Popped 9% today, but could be the pop before the last decline in this correction or start of a new trend, hard to say..
What Alts do you like?
I like DAG coins: nano, byteball & iota and supply chain coins such as vechain, walton coin and wabi. Regarding the platform coins like ethereum, the privacy coins like monero, the integration coins like ripple, or the identity coins like civic, as well as the exchange coins like binance, it's an ongoing battle with an unclear outcome. Although I am keeping a close watch on cardano.
Interesting, out of those I’ve only got Vechain, XRP & ETH.
My real faves are XVG, TRX, NEO, ETC and to a lesser extent EOS, STEEM & BTS. We’ll see what happens with Steem of course not looking as promising anymore...