Bitcoin Chart Analysis 30June 2017
Hello Fellow Steemers.
Introduction
Once in a while, I look at the Bitcoin charts and think of what they are telling me. I leave Bitcoin day trading to others and tend to look at the long(er) view. Below, I share my thoughts on the price developments and the directions that the charts may give. I note that charts and technical indicators do not predict the future; they only show the past. However, they may signal the probability of the next move.
Please note that all charts are logarithmic, meaning that any doubling - for example from $1,000 to $2,000 or from $3,000 to $6,000 - would be shown on a similar scale (i.e. a straight line). This filters away extreme price spikes as appearing from normal charts.
For the previous chart analysis article, see: https://steemit.com/bitcoin/@wekkel/bitcoin-chart-analysis-25-june-2017
Let's start with the first chart.
1. Daily Chart

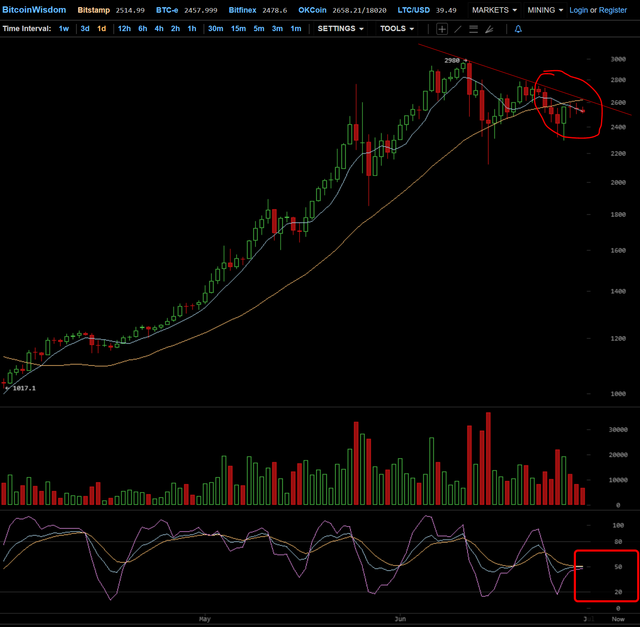
Daily chart (Bitcoinwisdom) - direct link
The Bitcoin daily chart continues to show weakness building up. We see a pattern of lower highs. The trendline as drawn in the price chart goes downward and, more over, the short term moving average has crossed the longer term moving average. KDJ on the bottom of the chart is also not reacting very wild to the upside, but muted.
To me this means: danger ahead. I expect weak price action the next week(s).
12Hrs Chart

12hrs chart (Bitcoinwisdom) - direct link
To support this notion of danger, let's look a little bit closer to what's happening (at the loss of accuracy because focusing in) See above a print of the 12hrs chart which zooms into this slowly deteriorating situation. I added the MACD indicator to show the moving average going below the middle line. This is a clear signal to me that we can expect weakness the coming week(s). This would align beautifully with the 'scaling debate' issue haunting Bitcoin. An excellent time to shake of some weakness in the market.
2. Three Day Chart

3 day chart (Bitcoinwisdom) - direct link
The 3 day chart shows the KDJ indicator progressing with its bending downwards. It is clearly looking for a landing place towards the 20-area and a nice bump of price into the longer term moving average (yellow line) would shake of weakness, put in a nice strong bottom again just around the 1 August 2017 deadline of the scaling debate and with this, an excellent launch platform back to higher grounds. Because the 12hrs and also daily chart show real deterioration, this move could shift into something bigger, with a movement to the $1,800-2,200 range. Again, this would fit a narrative of increased uncertainty in the Bitcoin scene now that the 1 August 2017 deadline is rapidly approaching.
If KDJ spikes downwards below 20 close towards 0 in such a larger move downwards, a buy in the zone marked green could prove to be an excellent choice.
4. Weekly Chart

Weekly chart ((Long View) (Bitcoinwisdom) - direct link
I have chose to show a different set up for the weekly chart this week. The KDJ indicator at the bottom can be used to mark clear bottoms that proved good opportunities to buy. We are a long way from the medium term moving average (yellow line), which hovers around $1,600 now. A strong move downwards to this level would cause mayhem in the minds of traders, but could mean a very nice and beautiful medium term bottom indicated by a clear spike of KDJ downwards below 20 towards 0; excellent for picking up a few cheap(er) bitcoins. But this pattern resolving completely would probably take some time and cause a lot of red on your screen the next few weeks. Steer clear from panic then.
And that brings me to the last chart.
4. Bullish Long View - Chart

Bullish as Hell (Masterluc's) (Tradingview) - direct link
Same as last week, but I will repeat it for showing the long term perspective.
This chart shows the most bullish projections for a 2017-2019 price spike up to $110k. It is my understanding that the person who made this chart (and maintains it over at Tradingview is the same as masterluc in the infamous 'Analysis never ends' thread over at Bitcointalk. He has been right numerous times in 2013 and he may be right this time.. But this will take a strong HODL attitude.
This is it for now. Happy trading (and HODL-ing).
DISCLAIMER: just sharing ideas, no trading advice. I am long Bitcoin.
Hope this prediction for the long term comes true. HODL-ing anyway! Except for the scaling issues (looks like some people try to damage Bitcoin) the fundamentals are also very bullish
Yes, it is still early in the game with the difference that the mainstream wave is coming. A bit out of place here (because technical analysis in the article, not fundamental) but consider the following:
Of course, this is more make believe than real theory - for now - but interesting to ponder.
Congratulations @wekkel! You have completed some achievement on Steemit and have been rewarded with new badge(s) :
Click on any badge to view your own Board of Honnor on SteemitBoard.
For more information about SteemitBoard, click here
If you no longer want to receive notifications, reply to this comment with the word
STOPBy upvoting this notification, you can help all Steemit users. Learn how here!
Interesting analysis my friend. Good luck with your Bitcoin :)
Nice post bro.
Wish the bitcoin will be pump on 2018.
Let see ahahah
Yes, that would be a real stunt.
You did great analysis to deploy charts