Bitcoin prices may fall to $5,600. Or is it really different this time?
HYPE
Bitcoin, the most popular digital currency, had a lot of hype lately for which skyrocketing prices are shown as a reason. Accordingly, if we look at the price change in 2017, it is seen that Bitcoin prices surged by %2000 which seems to prove this hypothesis. However, if we investigate the past a little bit deeper, we can see that there had been much better opportunities than today. So, what is different this time? And are the prices continue to go up? What happened in the past? Can it happen again? There are lots of questions.
In the past, there had been similar gains in much shorter periods of time but there wasn’t this much hype. Thus, it makes me think that there must be something else that created this much hype this time. I think we can name that reason behind as ‘word of mouth’, as people promote Bitcoin to their friends and families, and the community grows exponentially. Also, social media, blogs, booming ICOs, banks’ adoption of digital payment systems, recent opening of cryptocurrency future markets, TV news, and even the bans of stupid governments altogether add so much power to the hype around us.
As we can see, there are many reasons behind this recent increase in prices. Nevertheless, I do not believe any of these reasons can validate such high prices today. Truth is, I expect price to fall to $5,600 in just two months. Do you think it can’t happen? Just continue reading as I will provide you with scientific evidence.
REASONING
I know many readers will be arguing with me at this stage of the article but I strongly believe there is another bubble this time, just as Bitcoin had bubbles before which had also popped. Everyone is saying “This time it’s different” but I believe it’s not! And even there is a bubble, I know it is really difficult to estimate the popping point (the peak) but below you can see I am trying to find it out for you.
Let’s start with an example of an investment mania. Below you will find the steps of what happens when an investment method goes public and exponentially increases with the popularity due to word of mouth and media pumping. Then, you will find out what happens to the prices as smart investors that had bought in the beginning start selling.
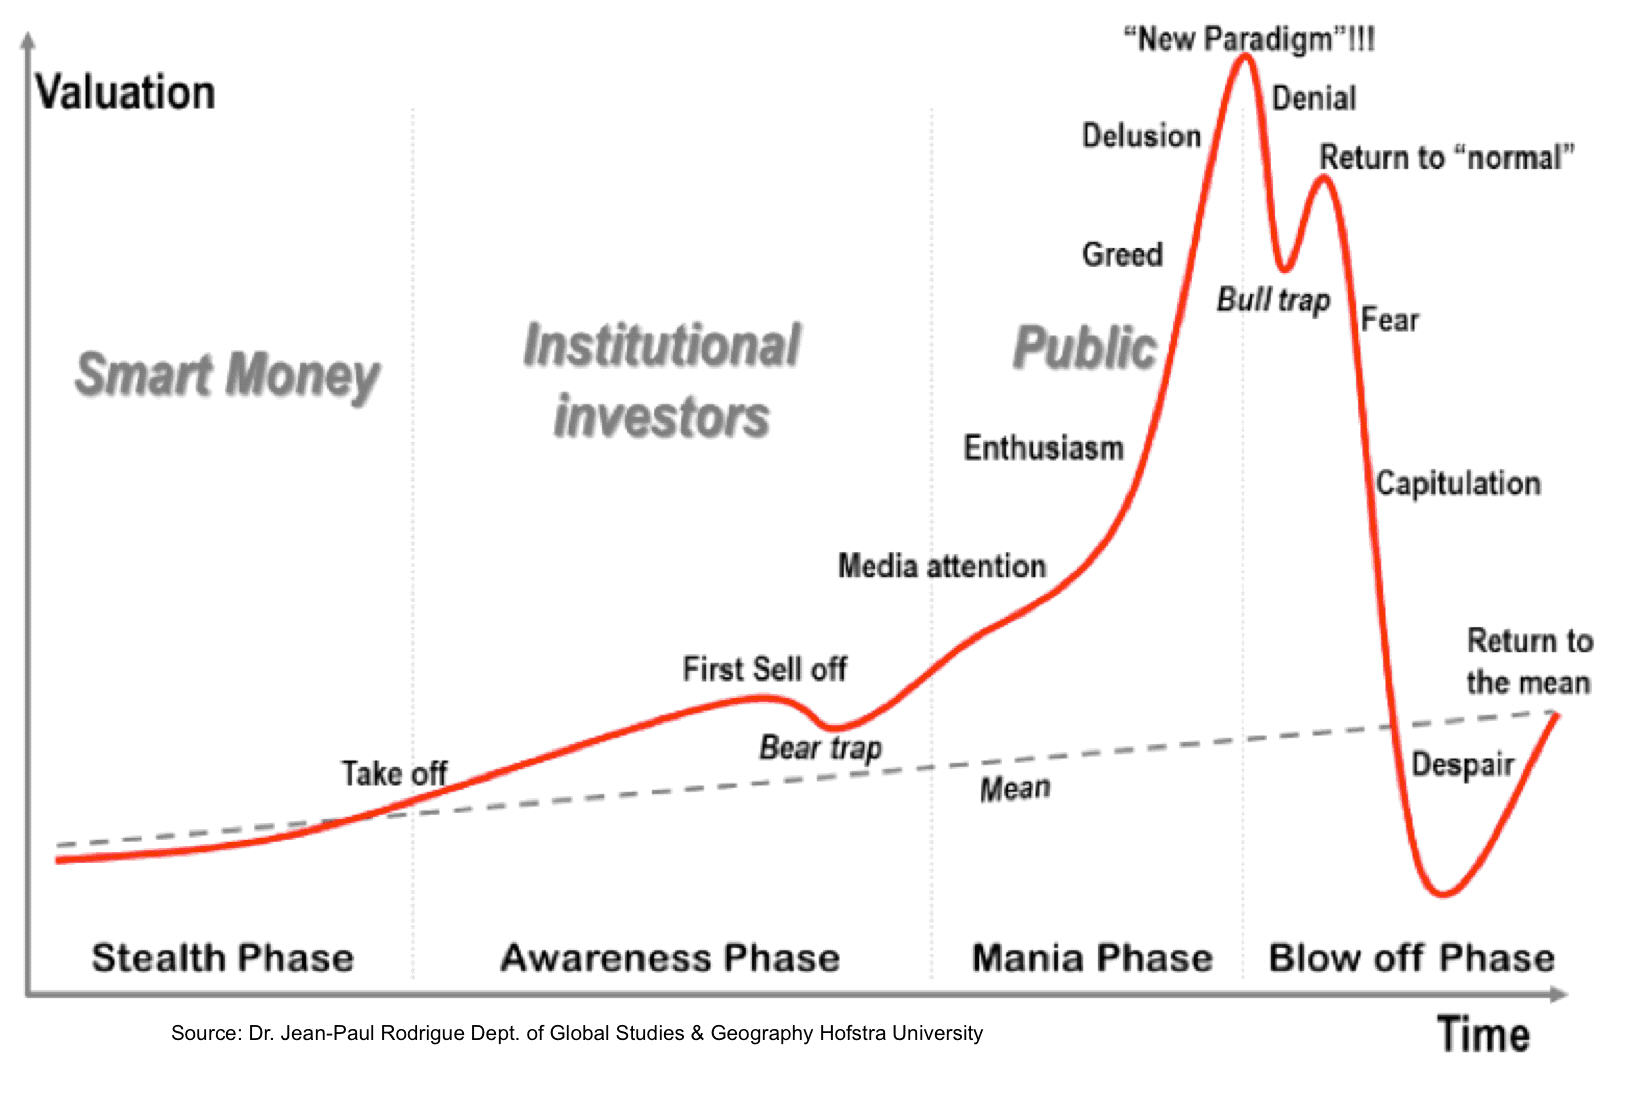
Now let’s have a look at the current Bitcoin chart. Similar, isn’t it? Current situation resembles me the ‘Return to normal’ point on the chart above.

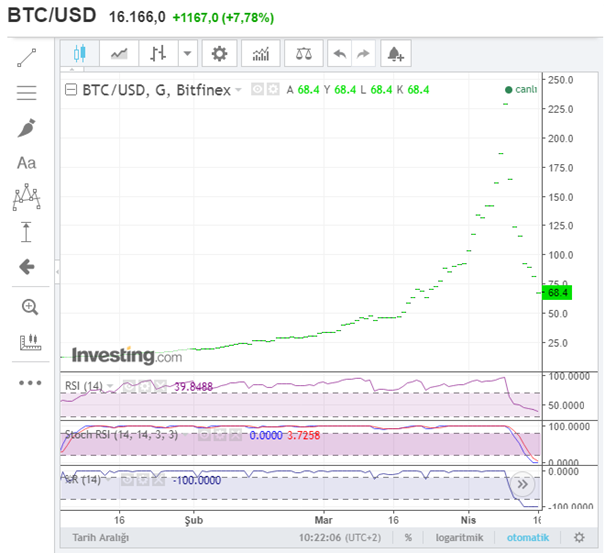
Now let’s look at the past examples and see how they were similar with today and how the prices were dumped afterwards. For instance, on the first day of year 2013, Bitcoin price was just $13.5 (see chart below). Are you thinking you are so unlucky for not buying at that time? Don’t worry you are not alone. On 09.04.2013, Bitcoin price was $230, meaning a 1700% increase, crazy right? So close to the %2000 surge in 2017 but in a much shorter period... However (read this carefully), just after another week it was $67.5, equaling to a 70% loss from the peak. You can see the chart below but it’s a bit confusing since Investing.com does not provide the candlesticks for data before November 2013.
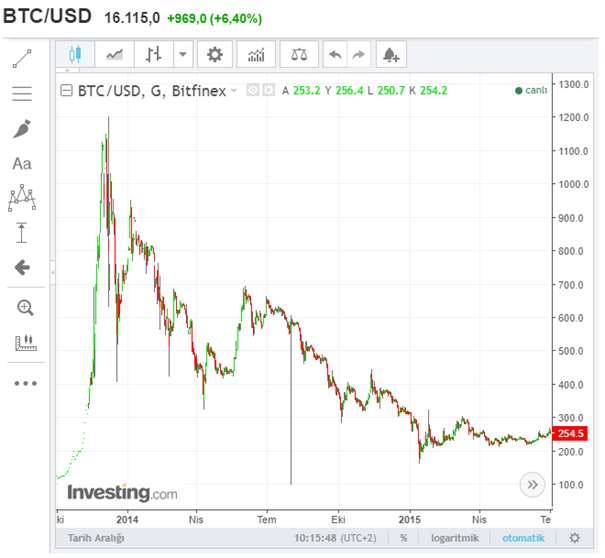
Let me give you another example. On 03.10.2013, Bitcoin was being sold for $98, and on 07.12.2013 for $1200, in other words, there was an increase of 1224% within just two months (see chart below). However, Bitcoin got caught in a bear market starting that day, losing value until seeing $166 on 14.01.2015, equaling to a 86% loss and also a whole lost year in terms of time due to wrong investment, not to mention the boring 7 months in which prices tried to stabilize after January. Crazier than before, isn’t it?
There are so many other examples of pump and dumps but these were the biggest that have ever happened yet. I am providing you these so that you should be careful about the possible next dump of Bitcoin. Remember, I cannot know the future and no one else can say that it will happen for sure but you should at least reconsider the risk, make an analysis of the possible gains and losses that might happen after this point in time, and either take profit or wait in the hope of more. In this sense, I have prepared a recent technical analysis of what might happen in bitcoin. As I said no one can know the future, I chose to prepare three analyses for myself and my fellow readers which you can find below.
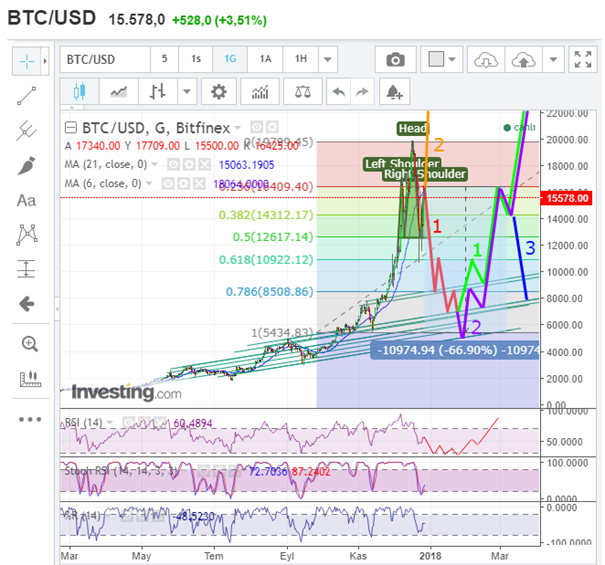
I think the most probable scenario for Bitcoin prices would be to follow the 1-2 (red & purple) lines as seen in the chart below. This means, I expect a loss of 67% from the current price. I would give this scenario a 45% chance to happen, while I would say 1-1 has a chance of 35%, and scenario 2 would just have 20% probability.
SCIENTIFIC BASIS
In my analyses, I am using scientific measures such as Fibonacci levels, shoulder-head-shoulder formation (which says if the price goes below $12,600, it might fall to $5,600), RSI, Stoch RSI, and %R indicators.
In addition to that, I am using my gut feeling which I had gained from 4.5 years of stock market experience. That feeling tells me that “if everybody around you has started talking about something, you should not look back and run away as fast as you can”.
The probabilities that I had allocated to the scenarios mainly come from this gut feeling and the parabolic price chart that all the investment bubbles have in common.
Furthermore, according to Elliot Waves analysis, price follows a wave-like trend on its journey and pumps and dumps repeat themselves in cycles, also in major supercycles. That is why financial crises occur in approximately every 10 years, and really significant financial crises happen in like every 90 years. In my analysis, I expect Bitcoin prices to follow a wave formation and think that it must lose value to come back even more powerful from the support levels below, as it has happened before which fits the cycle theory.
AFTER THE DUMP
Now let’s think for a moment about what might happen next. After some time, it is probable for Bitcoin to recover the losses and even exceed the current highest price of approx. $20,000 in my opinion.
On the other hand, it is more possible for other cryptocurrencies such as Ripple, Bitcoin Cash or Ethereum to topple Bitcoin from the throne and take its place due to their advantages such as faster transactions at lower costs and technological improvements like smart contracts. So, it may also never be possible to recover for Bitcoin after this huge dump in its prices and the serious damage to its reputation. Accordingly, it would not be unwise to expect the scenario 3 in the above chart after some recover of the prices.
RESULTS
To sum up, I expect a huge drop in Bitcoin prices until around $5,600 and then recovery of some of the losses, which will eventually pave the way for more advanced coins to surpass Bitcoin’s market cap.
Even if these scenarios do not work and prices continue to go up, yes, there would be an opportunity cost for taking profit early but one way or another I am sure this bubble will pop at some point, as it has happened before.
I hope this article will make you start considering the possible opportunities and risks of investing in Bitcoin and that you will act on your own analysis and reasoning, as this article is only to act as a guide for those who lack technical analysis skills and decent market experience, and not as an investment advice. I would not take any responsibility for the failure of these analyses and for potential losses.
ABOUT THE AUTHOR
Cem Göksel Özargun (29), is a mechanical engineer and a graduate of Istanbul Technical University, one of the top few universities in Turkey, after which he completed his master’s degree at University of Westminster in London on International Business and Management. He has had experience in several sectors and received many certificates and awards since. He is currently working on mobile app development projects which are his passion. He is also very interested in cryptocurrency and stock market investments and has invested in many coins, currently keeping almost 100 coins under radar and following up ICOs.
you never know what to expect... There are a lot of factors in play. Cryptocurrencies do not necessarily behave like fiat currencies. Remember that they are decentralized. However, the deeper you dive into cryptos, the more insights you will gain over time.
cryptos are going to go higher in the future but btc is less technologically advanced than others and this is why we are not just seeing it price drop but also its market dominance.
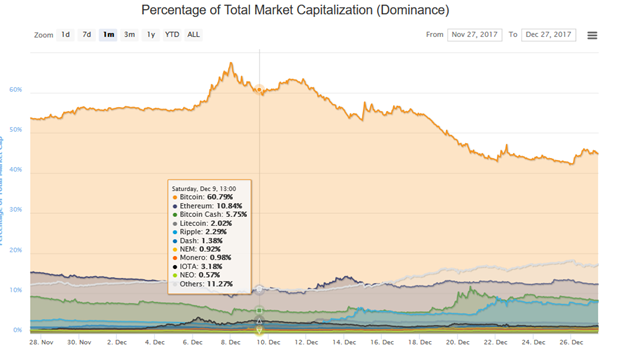
image from coinmarketcap.com
as you can see over the last month it has dropped significantly
I basically agree; but it also depends on expectations and information sampling by trading crowds.
There is a superabundance of information, not a scarcity. Just that most people do not bother to go through it all. Too costly. So much of it and most useless. Therefore exists a low probability of covering search costs. In that case the Bitcoin position as "First" and "Most Popular" (echoing Ries, Trout, and recently, McAfee) are sufficient for to individuals buy it — even when they hear news of other coins going up. If the high price does not motivate individuals to bother to learn what coin is most interesting, then another two patterns are possible for a while.
(1) If crowds are mostly uninformed: people buy, price rises, they sell to lock in gains, price falls somewhat, seeing this, more such people buy including those who sold, price goes even higher, they sell, for the same reason, prices falls percent wise even more but to a floor higher than it was, and so on. This repeats at multiple time scales. Not all individuals buy and sell at once but in random clumps and some make decisions more or less slowly depending on their risk preferences.
(2) If the uninformed crowds also have too high expectations: they buy, then wait and then sell even if the price goes up but not so quickly as they wanted, and then it goes down.
Such patterns can be superposed on your pattern depending on the detailed composition of trading crowds.
Positions are surprising resilient when information is too plentiful (Ries Trout, 1987, Positioning). In my estimation it could go for double or triple what the recent peak was. The way to know if that is happening is to look at whether volatility is following a power law. (Is scale invariant or not.) That would indicate whether the first process is occurring or not and what is the mode composition of the crowd.
This is why cycling and fractal like behavior occurs in waves. (Elliot waves in triangle occur when corrections arise from dampening by expections (process 2) following a rapid but increasing volatile rise (process 1). Crowds typically are underinformed by choice and therefore behave in cellular automaton fashion more often than not. Results in some order scale invariant behavior, feedback, and dampening over several time intervals superposed.
Thank you for this one. Good post.....
Congratulations @velvetmoon! You have completed some achievement on Steemit and have been rewarded with new badge(s) :
Click on any badge to view your own Board of Honor on SteemitBoard.
For more information about SteemitBoard, click here
If you no longer want to receive notifications, reply to this comment with the word
STOPResteemed by @resteembot! Good Luck!
The resteem was paid by @greetbot
Curious?
The @resteembot's introduction post
Get more from @resteembot with the #resteembotsentme initiative
Check out the great posts I already resteemed.
Looking at the close-up updated version of my previous anaylsis found below, I can say that the odds of a decrease in prices are falling. The declining green line that is drawn from head down through the right shoulder is breached (right at the green circle I have placed) and that might be the sign of another sharp increase (Now i think this option has a chance of around 60-70%).
I just wanted to warn those who have read this and would like to remind that price was above $16.000 when I made the previous analysis and is still at $15.000, so noone has made a loss. It is best to reconsider before it is too late.
Afterwards, I would expect the prices to make a second high at $20.000 (purple line), and then increase/decrease chances are 50%-50% in my opinion.
On the other hand, if prices continue falling from now on and $11.900 support is breached, then $5.600 scenario would be on the table again.
Hi. I am @greetbot - a bot that uses AI to look for newbies who write good content!

Your post was approved by me. As reward it will be resteemed by a resteeming service.