This example is one of the reasons technical analysis is difficult The scale of your charts can dictate how you perceive the relationships. I've heard some call Elliott waves pareidolia. Human minds seek patterns. The randomness of market data can lend itself to patterns real or phantom. Thus the difficulty in charting.
Thumbs down for me then. I didn't look closely enough to see you were on the same scale. I can see you were zoomed out a bit more than Haejin was but not enough to change the results.
Every marketplace will have variations. That too is a factor in trying to suss out what all of the markets are going to do.
This example is one of the reasons technical analysis is difficult The scale of your charts can dictate how you perceive the relationships. I've heard some call Elliott waves pareidolia. Human minds seek patterns. The randomness of market data can lend itself to patterns real or phantom. Thus the difficulty in charting.
It's only difficult before learning it. It's very easy afterwards.
I had to google that one friend, up steemed just for that. Pretty sure I have watched a documentary about it too... thumbs down for me.
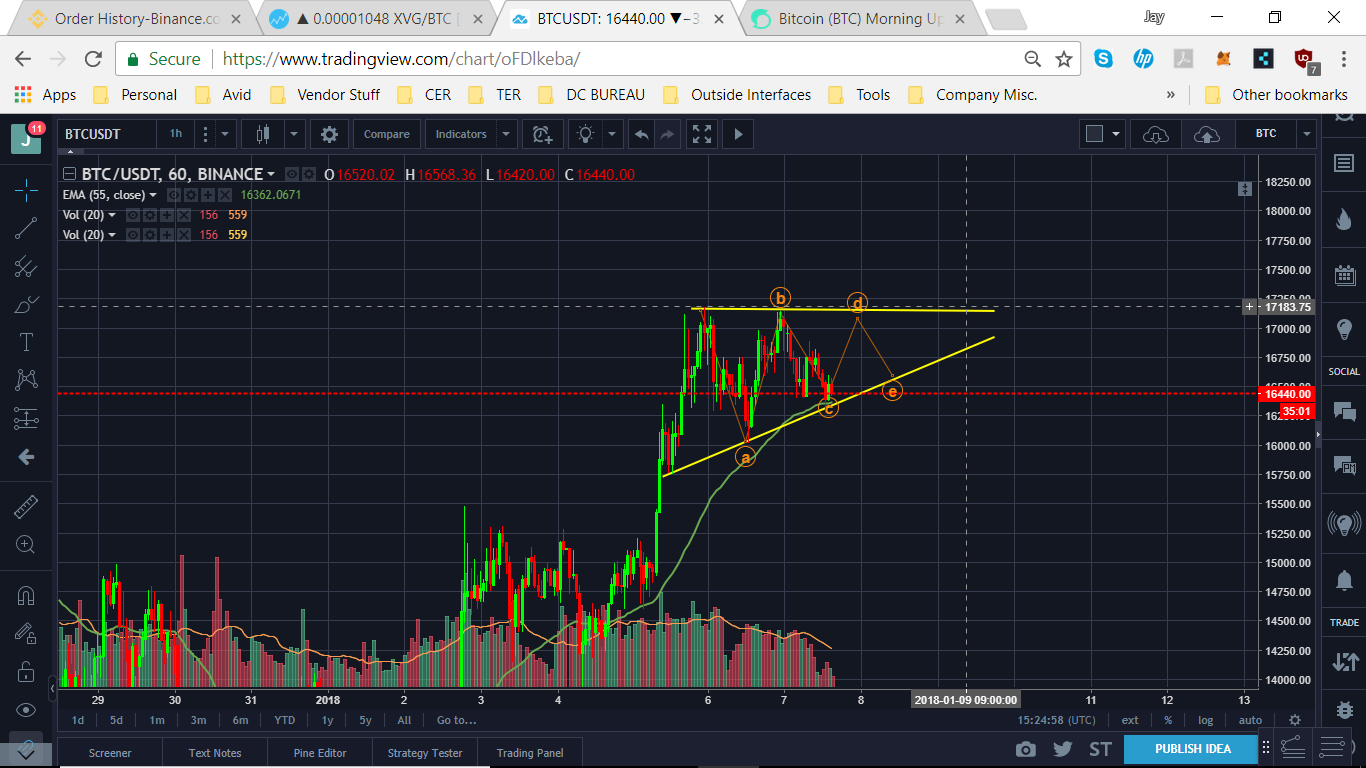
*just realized we were on the same time frame, different chart. I use Binance.
Same here :-) The word itself made me curious. It's great to learn something new each day, even small thing, like meaning of pareidolia :-)
Thumbs down for me then. I didn't look closely enough to see you were on the same scale. I can see you were zoomed out a bit more than Haejin was but not enough to change the results.
Every marketplace will have variations. That too is a factor in trying to suss out what all of the markets are going to do.
Lets give eachoter an upvote....Steem for life :-)
Well done!