Bitcoin update 24.feb.18, Breaking my TA down in D.Tube video
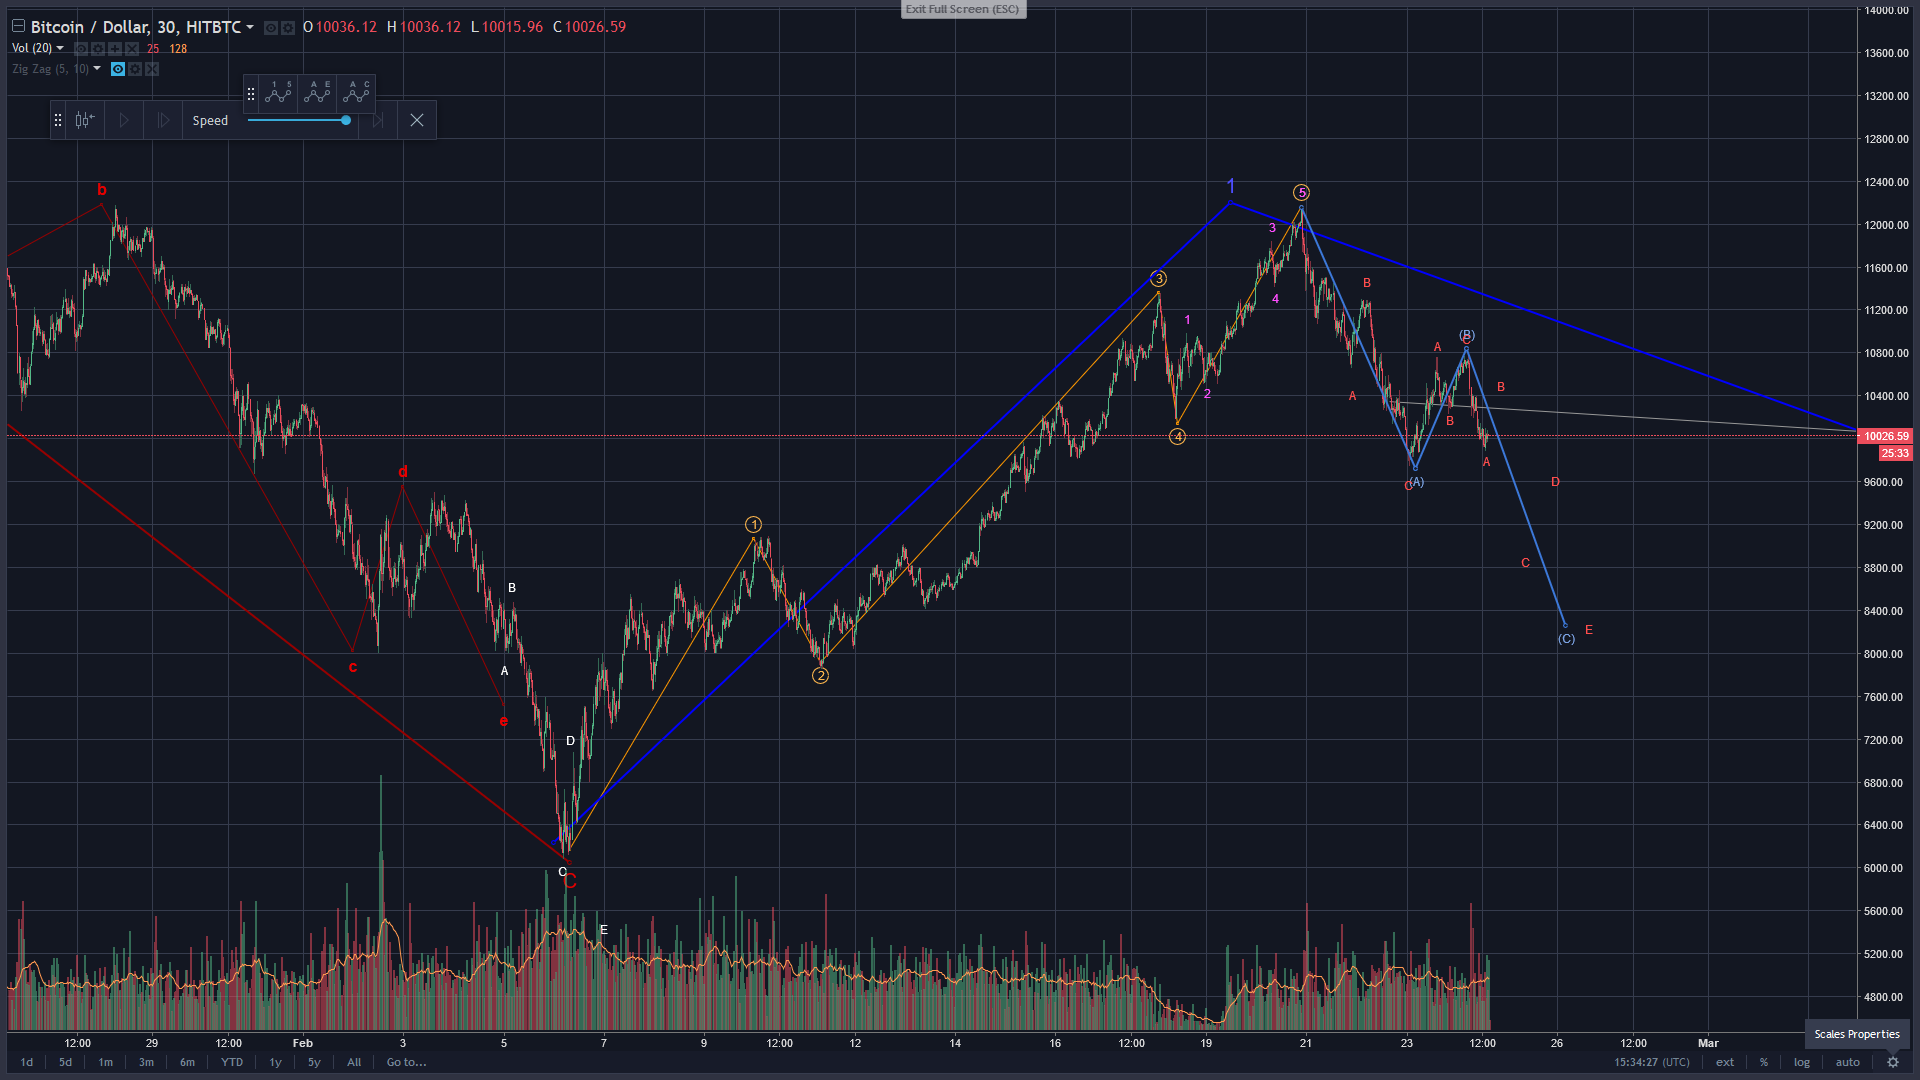
Here is a screencapture of the last weeks price movements in Bitcoin at Hitbtc, resulting in my last chart from 2 days ago broken.
BTCUSD_ 9999.19 ▼ — Breaking my TA video
This is first time I use d.tube, and after a couple small hickups I finally made an upload.
The inverted HS in the face of Bitcoin never fulfilled, and the correction fit well into an ABC, the usual type after a full 5 waves up. I expect bottom to be reached around $8,200.
These are just my thoughts, not a trading advice.
If you have another view on this charts your welcome to discuss and post your charts in the comments.

Comments are highly appreciated, and please
upvote, resteem and follow me if you profit or otherwise enjoy my posts !
If you feel like buying me a beer,just send me some STEEM :)
PS: Don't forget to Upvote :)
We might be going down to 5k this time?
I don't think we'll have a lower low as we had a full 5 wave up and both proportions on the waves and fibonacci indicate $8,100 to $8,400. Most likely we are in a 2. wave correction of a larger degree bull cycle.