📊 Bitcoin is tricky to do TA on now. But that's just great :)
Here is the last chart I posted two days ago, and as you can see it did not go after my 4th green Elliot Wave. May be it did already in the small wick down just after the 0.618 fibonacci mark. It looked so insignificant, so I neglected it.
The drop stopped about when I posted the last chart, failing to meet my target zone. It may seem like the price is suppressed with market sells, maybe some large capasity is picking up at a steady pace below and want to keep it down?
Still building the bear flag, and bearish divs on the RSI, but still I am turning more bull now as in a larger scale something more signifficant is happenening today.
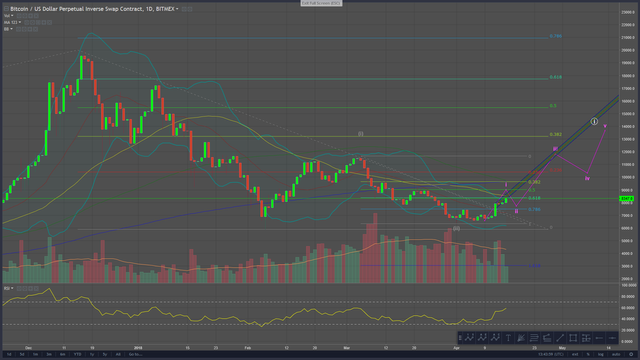
Look at the daily chart here. How long can the bear flag be built?

Price has broken the Bollinger Bands today, and if today's candle close above it is very bull. It did pinch it with the wick in february, and last close above the bands was last year!
In my bull scenario we are now building up to the pink wave i, which is in a larger wave white circled i, again in a larger degree grey wave (i) from the beginning of February.
These are just my thoughts, not a trading advice. Do your own research before buying or selling.
If you have another view on this post your welcome to discuss and post your charts in the comments.
If you'd like my technical analysis on another coin, please ask in the comments.

Comments are highly appreciated, and please
upvote, resteem and follow me if you profit or otherwise enjoy my posts !
I use these exchanges:
Support me using these services
