The Fallacy of Technical Analysis for Bitcoin and Pretty Much Everything Else
December 25, 2018
Although many in the cryptocurrency space utilize technical analysis (TA) - based predominantly on discoveries made in the 13th century by an Italian mathematician known as Fibonacci - to determine their buy and sell decisions, any investor seeking to accumulate wealth for the long-term should avoid, like the plague, this trading methodology given today’s thoroughly manipulated global financial markets.
To summarize this article, technical analysis is a flawed investment methodology in today's global financial markets that will likely leave its adherents with little left in the pocket in the long-run. Technical analysis can be worse than determining investment decisions based on a flip of a coin – at least with a flip of a coin you should be right at least half of the time. This is the gist of this article, however, if you would like to learn more about the concepts that are used to support technical analysis, please read on.
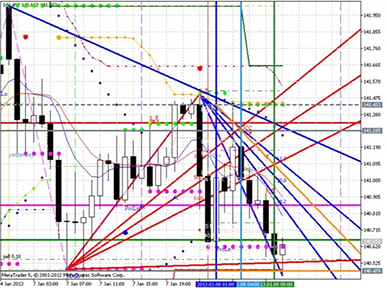
It is apparent that a large portion of Bitcoin prognosticators utilize technical analysis, exclusively, to provide predictions on the future price movement of Bitcoin. They often use TA terms such as Fibonacci Retracements, Fibonacci Fans, Fibonacci Arcs, or Bollinger Bands (all mumbo-jumbo technical-sounding TA terms that should mean nothing to serious, long-term investors) to show why they think the price of Bitcoin will go up or down based on pictures of past price movements of Bitcoin with little understanding of the foundational theories behind why technical analysis may possibly work in the real world.
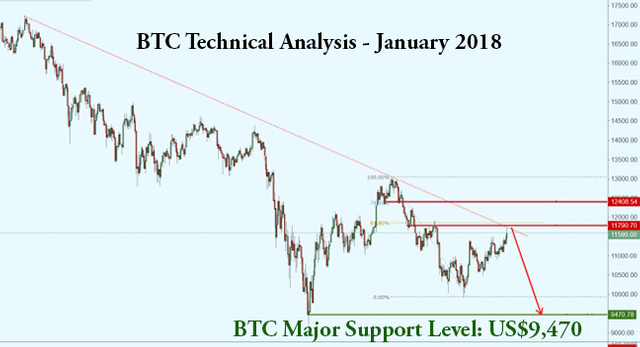
For the most part, TA pundits utilize graphs like the one below showing past price movements of a given asset superimposed with drawn out lines according to a set of numbers and ratios first discovered by Fibonacci many centuries ago during the height of the Islamic Golden Age.
Along with a number of mathematical discoveries that eventually ignited the European Renaissance centuries later in the 1500’s with the advent of the printing press, Fibonacci discovered a set of fascinating numbers in the natural world that TA pundits utilize today to predict future price movements of any given asset traded on an exchange.
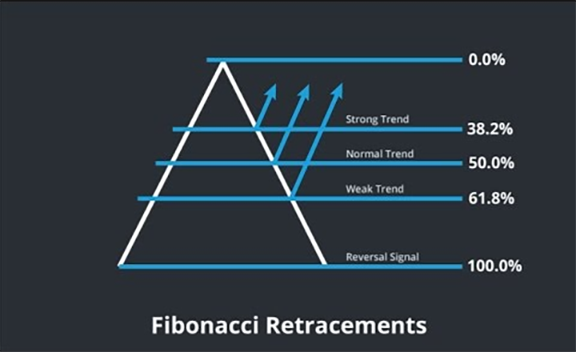
These key Fibonacci numbers are shown below (please note: although 50% is not a Fibonacci number, it is used by TA pundits in their analysis):
Difficulty of Valuing Bitcoin
It is difficult to place a value on something so relatively new and transformational as Bitcoin and other cryptocurrencies such as Cardano or Zcash, as this new asset class isn’t something tangible such gold or a legal document such as a stock representing ownership of a real-world asset that can be priced using traditional valuation methodologies such as discounted cash-flow analysis.
Bitcoin and the ability to transfer wealth across the internet to anyone in the world without any third-party involvement has considerable value of some kind, but there is yet to be a general consensus on this matter – this topic will be for another piece in the future – but suffice it to say, it is difficult to value Bitcoin with any traditional valuation methodology.
Without a commonly accepted means to value Bitcoin, many in the cryptocurrency space have resorted to staring at funny-looking pictures without much real meaning (i.e., technical analysis) to determine their fate and fortune.
Background of Technical Analysis
Technical analysis is based, in large part, on two concepts:
Fibonacci Numbers; and
The Efficient Market Hypothesis.
Fibonacci Numbers
In 1202, a book titled Liber Abaci, or Book of the Abacus, was written by a 27-year-old author named Leonardo Pisano. For most of his life, he was known as Fibonacci, a contraction of “figlio di Bonacio”, or son of Bonacio. Bonacio headed a prominent family in Pisa, Italy who allowed his son to travel across the Mediterranean and throughout the Islamic Empire in Northern Africa and the Middle East, which at that time, was at its height before the onslaught of the Mongol horde a few decades later that brought the Islamic Empire to its knees and its eventual downfall and set the stage for the beginning of the European Renaissance in the 14th century.
During Fibonacci’s travels in the Islamic Empire, an Arab mathematician revealed to him the revolutionary Hindu-Arabic numbering system that we all use today. Realizing the extraordinary manner in which numbers could replace Roman letters for counting and calculating, Fibonacci eagerly absorbed this fascinating new numbering system that included the concept of zero, which allowed calculations in tens, hundreds and so on – something impossible with the then existing counting system with Roman letters used throughout Europe.
(How difficult is it to divide LXIV by XCIV? Answer: very.)
With the newfound tool of the Hindu-Arabic numbering system, Fibonacci revealed to Europe concepts such as whole numbers, fractions, rules of proportion, extraction of square roots, roots of higher orders, solutions for linear and quadratic equations, commercial bookkeeping, conversions of weights and measures and calculations of interest. (It would take nearly three centuries for Fibonacci’s book, Liber Abaci, to fully take hold across Europe with the advent of the Gutenberg printing press in 1439)
Within Liber Abaci, Fibonacci revealed an astounding mathematical discovery known as the Fibonacci series with the calculation of how many rabbits would be born from an original set of rabbits. These Fibonacci numbers are as follows: 1, 2, 3, 5, 8, 13, 21, 34, 55, 89, 144, 233…and so on.
The fascinating characteristic of this set of numbers is:
Divide any Fibonacci number by the next higher number after 3, the answer is always 0.625. After 89, the answer is always 0.618 with higher numbers having more decimal places; and
Divide any number by its preceding number, after 2, the answer is always 1.6, and after 144, the answer is always 1.618.
The Greeks knew of this proportion, and they called it the Golden Mean.
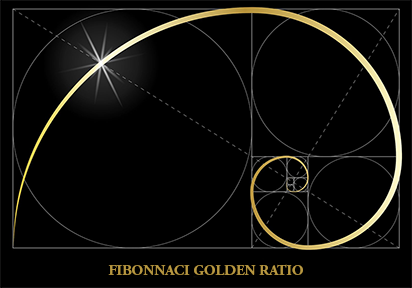
The Golden Mean or Golden Ratio is found throughout nature and the universe: the length of each bone in our fingers bears this ratio, from tip to hand; the spirals of a nautilus shell or galaxies across the Milky Way; the movement of a school of fish or a flock of birds, or waves at sea or hurricanes swirling across a continent – these all contain at times manifestations of the Fibonacci Ratio.
The key point of Fibonacci numbers for our discussion today is that is it often seen in the NATURAL WORLD where individual parts of a whole collectively come together to form Golden Ratios.
For technical analysis, the primary factor of importance is that each individual part of the whole is impacted solely by the forces of nature such as gravity, and that the parts do not act independently whether it is a water molecule in a wave or a star in a swirl of a distant galaxy.
Therefore, to use Fibonacci numbers in the context of predicting the future price movement of a financial asset such as Bitcoin, the primary assumption that must be made is that all investors are of essentially equal footing and weight, acting independently, but collectively, like a flock of birds or a school of fish, manifesting into neat, tidy patterns revealing the Golden Ratio.
This is the fundamental flaw of technical analysis used today – it assumes that each and every participant in a given financial market acts and responds uniformly like a water molecule in a wave to form Fibonacci patterns that can be easily seen and interpreted by anyone who can draw some lines on a piece of paper.
Human beings are obviously not mindless water molecules in the ocean or fish in the sea - they are free thinking, independent, sentient beings that can act in unpredictable, and often times, irrational ways given the same set of forces placed against it.
Technical analysis assumes that investors are essentially all the same, reacting in similar fashion to random market forces to collectively form predictable patterns found in nature that can be easily interpreted to predict the future using Fibonacci numbers.
This assumption is obviously flawed as there are a lot of crazy, illogical people in this world that tend to collectively form patterns of chaos - especially when dealing with money - and not neat, predictable patterns manifesting Fibonacci Ratios.
Efficient Market Hypothesis
Similar to the flawed assumption that is required of technical analysis that all participants in financial markets are essentially the same, the Efficient Market Hypothesis, which is also a pillar of technical analysis, also assumes the uniform equality of all market participants.
As explained at https://corporatefinanceinstitute.com/resources/knowledge/trading-investing/efficient-markets-hypothesis/:
The Efficient Markets Hypothesis is an investment theory primarily derived from concepts attributed to Eugene Fama’s research work as detailed in his 1970 book, “Efficient Capital Markets: A Review of Theory and Empirical Work”. Fama put forth the basic idea that it is virtually impossible to consistently “beat the market” – to make investment returns that outperform the overall market average as reflected by major stock indexes such as the S&P 500 Index. According to Fama’s theory, while an investor might get lucky and buy a stock that brings him huge short-term profits, over the long term he cannot realistically hope to achieve a return on investment that is substantially higher than the market average.
Fama’s investment theory – which carries essentially the same implication for investors as the Random Walk Theory – is based on a number of assumptions about securities markets and how they function. These assumptions include the one idea critical to the validity of the efficient markets hypothesis: the belief that all information relevant to stock prices is freely and widely available, “universally shared” among all investors. As there are always a large number of both buyers and sellers in the market, price movements always occur efficiently (i.e., in a timely, up-to-date manner). Thus, stocks are always trading at their current fair market value.
For technical analysis and the Efficient Market Hypothesis to work for Bitcoin, two primary assumptions must be true:
There is no omnipotent entity like the Federal Reserve with an endless supply of money that can buy and sell whatever asset it wants, whenever it wants; and
There is no concentration of ownership of Bitcoin held be a few parties that can impact by themselves the price of Bitcoin.
As discussed in my previous article, the Fed manipulates the price of Bitcoin – so number 1 above doesn’t apply - as the Fed is an almost omniscient power in financial markets able to move prices of any given asset by itself whenever it chooses.
And for assumption number 2, it is a fact that 97% of all Bitcoin are held by 4% of addresses – so, number 2 doesn’t apply for Bitcoin as well.
Both assumptions that must be true for technical analysis to work for Bitcoin are obviously false, so the only logical conclusion that can be made is, don’t rely on technical analysis to make any of your investment decisions.
Final Thoughts
Technical analysis is no better than flipping a coin to determine investment decisions, in fact, it’s even worse because it can be used by market manipulators such as bankers and the Fed to determine when they enter the market to drive the price of Bitcoin down and weaken further market sentiment for Bitcoin.
As an example, when Fibonacci support levels are reached, technical analysis indicators will show a strong “buy signal” encouraging retail investors to enter the market. As retail investors start investing in Bitcoin, market manipulators can simply start selling futures on the CBOE and the CME. This timed selling pressure by the Fed and banks - when all technical analysis indicators show a strong buy signal - will only deteriorate market sentiment for Bitcoin further as retail investors are again fleeced.
Technical analysis is simply looking at funny pictures that have no real meaning and should not be used for anything other than keeping aware of what retail investors may be up to. Investors are not mindless water molecules with no independent thought that collectively form neat, beautiful Fibonacci patterns. If my friends are any indication, people in general are some truly irrational creatures that think independently, but often times illogically, forming collectively nothing more than chaotic patterns of nonsense that reveal absolutely nothing.


@temujinx, thank you for supporting @steemitboard as a witness.
Click on the badge to view your Board of Honor.
Once again, thanks for your support!
Do not miss the last post from @steemitboard: