Bitcoin Price Technical Analysis For December 22nd, 2016 - Price Correction Attempt Ahead
As we expected during yesterday's analysis, bitcoin price rose to score a high of $810 on bitstamp during yesterday's trading sessions. Today's trading sessions continued to push bitcoin price to higher levels scoring a high of $874 on Bitstamp by the time of writing of this article. So, will bitcoin price continue rising subsidized by the market's bulls? or will we see a price correction attempt before further advancement?
Bitcoin Is Overbought On The 1 Day BTCUSD Chart:
By examining the 1 day BTCUSD chart from Bitstamp, keeping the Fibonacci retracements and Gann angle placements we plotted during yesterday's analysis, executing the MACD indicator and Stochastic oscillator, we can notice the following:
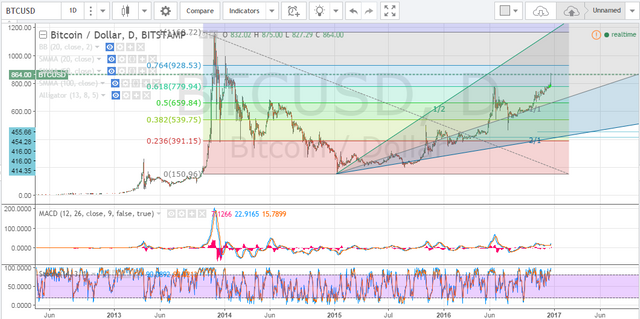
- Bitcoin price rate of rise increased significantly after breaking through the resistance around $779 which corresponds to the 61.8% Fib retracement level. Price is now trading well above the 1 x 1 Gann angle and the candlesticks are steadily moving away from the 1 x 1 angle level which signifies an increased rate of rise due to lack to significant resistance level around this price level.
- Bitcoin is now trading at $864.44 which is $10 lower than the high recorded earlier today, so price correction is already in action. The MACD indicator is in the positive territory but the negative trend line is above the positive trendline. Furthermore, the stochastic oscillator values around 86, which means that bitcoin is overbought at the current price. Both the MACD and stochastic signal a downwards price correction attempt.
Price Correction Started On the 1 Hour BTCUSD Chart:
Let's take a look at the 1 hour BTCUSD chart from Bitstamp while executing Williams Alligator indicator. We can notice the following:
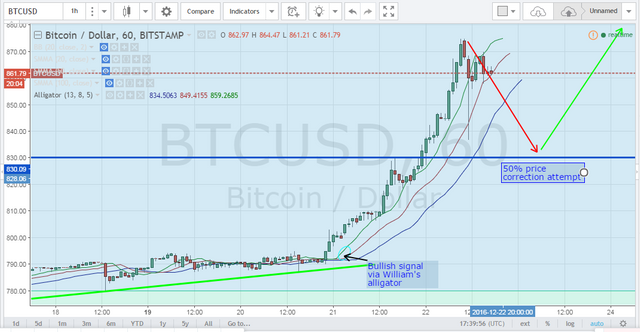
- Bitcoin price rose significantly after the Williams Alligator indicator exhibited a bullish alignment (refer to yesterday's analysis for more details). The price continued rising until a high of around $874 was scored.
- The first bearish candlestick was formed after 4 successive bullish candlesticks. We can see a downwards price correction attempt that takes price down to a level that represents 50% of the rise that took place during the past 24 hours or so. So, as shown on the above chart, we can see price drop down to around $830 before price continues to rise again.
Conclusion:
Bitcoin price continued rising to record a high of $874 on Bitstamp earlier today. Our technical analysis predicts a downwards price correction attempt that can take price down to around $830 before the bullish wave can take over again.
This post has been linked to from another place on Steem.
Learn more about and upvote to support linkback bot v0.5. Flag this comment if you don't want the bot to continue posting linkbacks for your posts.
Built by @ontofractal