SWIFTCASH ROI, MINIMUM & MAXIMUM INFLATION

Most people in the world still have no clue how economy works or what are some of the major problems with fiat currencies that has got so many people interested in alternatives such as bitcoin or other cryptocurrencies. But many of cryptocurrency enthusiasts don't seem to understand the economics of each cryptocurrency. They usually get lost at the last price which is really not that important in the long-run. Very few people tend to look at the inflation of a cryptocurrency, or its current emission, its future emission and things like that.
In this article, we're going to examine the inflation of SwiftCash and set it as a benchmark to teach you how you're supposed to look at these things before investing. SwiftCash has a pretty complicated and unique economical model, so if you learn how to investigate the inflation of SwiftCash, you can easily investigate the inflation of all other cryptocurrencies! Sounds like a pretty good read then, doesn't it?!
For starters, SwiftCash does not give all the inflation to traditional miners with giant computers. In fact, SwiftCash does not give ANY of its inflation to traditional miners! Traditional mining uses a lot of energy to secure the network, and does not set aside any part of its inflation for human labor required to push for development, support and adoption. To find out how to mine/earn SwiftCash, feel free to pay a visit to our recent post on this topic here, and you can find more information about some of the concepts in our whitepaper.

Having said that, SwiftCash has a minimum and maximum inflation and the actual inflation depends on how much of the SwiftCash budget is mined each month which is decided via consensus among the stakeholders. Furthermore, unlike traditional cryptocurrencies such as Bitcoin or Litecoin, SwiftCash gives the minimum inflation to its stakeholders. That is Bitcoin miners for example, do not need to own any Bitcoin, in order to be able to get the new Bitcoins! But with SwiftCash, miners are required to own and HODL SwiftCash, in order to be able to get the new coins!
With SwiftCash, 30% of maximum inflation goes to Miners and/or Masternodes, both of whom are required to own and HODL a certain amount of SwiftCash. These guys who play a major role in securing the network, very much like what traditional miners do, are therefore themselves required to be invested in the network, unlike the case with traditional miners. What they get therefore, becomes the minimum inflation.
Stakeholders can participate in consensus each month in order to determine whether the SwiftCash blockchain should inflate more in order to fund interesting proposals such as the most recent one which was to airdrop steemians here. While there is a ceiling for this type of inflation every month, to make sure we won't inflate too much, the ceiling is enforced to go down in proportion to what Miners and/or Masternodes get. That is to say the total amount of budget that can be mined each month will gradually move towards zero regardless of how much of it is mined each month, or not.
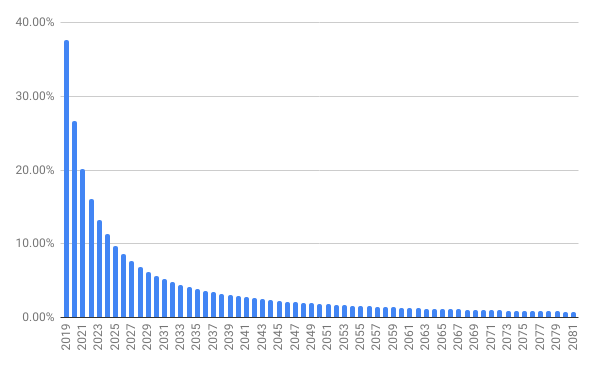
To recap, below you can see the minimum annual inflation of SwiftCash in the next 60 years! This is based on the amount of block rewards that will be given to Miners and/or Masternodes who are required to be stakeholders, in order to keep the network active, online and secure. Unlike traditional cryptocurrencies such as Bitcoin or Litecoin, SwiftCash Miners and/or Masternodes do not get the transaction fees, but fees are rather burned out of the circulating supply, and can be mined back in the future.
SwiftCash — Minimum inflation up to year 2081

| Year | New Supply(Min) | Initial Supply(Min) | Inflation(Min) |
|---|---|---|---|
| 2019 | 29,462,857.14 | 78,200,000.00 | 37.68% |
| 2020 | 28,669,090.91 | 107,662,857.14 | 26.63% |
| 2021 | 27,422,608.70 | 136,331,948.05 | 20.11% |
| 2022 | 26,280,000.00 | 163,754,556.75 | 16.05% |
| 2023 | 25,228,800.00 | 190,034,556.75 | 13.28% |
| 2024 | 24,258,461.54 | 215,263,356.75 | 11.27% |
| 2025 | 23,360,000.00 | 239,521,818.29 | 9.75% |
| 2026 | 22,525,714.29 | 262,881,818.29 | 8.57% |
| 2027 | 21,748,965.52 | 285,407,532.57 | 7.62% |
| 2028 | 21,024,000.00 | 307,156,498.09 | 6.84% |
| 2029 | 20,345,806.45 | 328,180,498.09 | 6.20% |
| 2030 | 19,710,000.00 | 348,526,304.54 | 5.66% |
| 2031 | 19,112,727.27 | 368,236,304.54 | 5.19% |
| 2032 | 18,550,588.24 | 387,349,031.81 | 4.79% |
| 2033 | 18,020,571.43 | 405,899,620.05 | 4.44% |
| 2034 | 17,520,000.00 | 423,920,191.48 | 4.13% |
| 2035 | 17,046,486.49 | 441,440,191.48 | 3.86% |
| 2036 | 16,597,894.74 | 458,486,677.96 | 3.62% |
| 2037 | 16,172,307.69 | 475,084,572.70 | 3.40% |
| 2038 | 15,768,000.00 | 491,256,880.39 | 3.21% |
| 2039 | 15,383,414.63 | 507,024,880.39 | 3.03% |
| 2040 | 15,017,142.86 | 522,408,295.03 | 2.87% |
| 2041 | 14,667,906.98 | 537,425,437.88 | 2.73% |
| 2042 | 14,334,545.45 | 552,093,344.86 | 2.60% |
| 2043 | 14,016,000.00 | 566,427,890.32 | 2.47% |
| 2044 | 13,711,304.35 | 580,443,890.32 | 2.36% |
| 2045 | 13,419,574.47 | 594,155,194.66 | 2.26% |
| 2046 | 13,140,000.00 | 607,574,769.13 | 2.16% |
| 2047 | 12,871,836.73 | 620,714,769.13 | 2.07% |
| 2048 | 12,614,400.00 | 633,586,605.87 | 1.99% |
| 2049 | 12,367,058.82 | 646,201,005.87 | 1.91% |
| 2050 | 12,129,230.77 | 658,568,064.69 | 1.84% |
| 2051 | 11,900,377.36 | 670,697,295.46 | 1.77% |
| 2052 | 11,680,000.00 | 682,597,672.82 | 1.71% |
| 2053 | 11,467,636.36 | 694,277,672.82 | 1.65% |
| 2054 | 11,262,857.14 | 705,745,309.18 | 1.60% |
| 2055 | 11,065,263.16 | 717,008,166.32 | 1.54% |
| 2056 | 10,874,482.76 | 728,073,429.48 | 1.49% |
| 2057 | 10,690,169.49 | 738,947,912.24 | 1.45% |
| 2058 | 10,512,000.00 | 749,638,081.73 | 1.40% |
| 2059 | 10,339,672.13 | 760,150,081.73 | 1.36% |
| 2060 | 10,172,903.23 | 770,489,753.86 | 1.32% |
| 2061 | 10,011,428.57 | 780,662,657.09 | 1.28% |
| 2062 | 9,855,000.00 | 790,674,085.66 | 1.25% |
| 2063 | 9,703,384.62 | 800,529,085.66 | 1.21% |
| 2064 | 9,556,363.64 | 810,232,470.28 | 1.18% |
| 2065 | 9,413,731.34 | 819,788,833.91 | 1.15% |
| 2066 | 9,275,294.12 | 829,202,565.26 | 1.12% |
| 2067 | 9,140,869.57 | 838,477,859.37 | 1.09% |
| 2068 | 9,010,285.71 | 847,618,728.94 | 1.06% |
| 2069 | 8,883,380.28 | 856,629,014.65 | 1.04% |
| 2070 | 8,760,000.00 | 865,512,394.93 | 1.01% |
| 2071 | 8,640,000.00 | 874,272,394.93 | 0.99% |
| 2072 | 8,523,243.24 | 882,912,394.93 | 0.97% |
| 2073 | 8,409,600.00 | 891,435,638.18 | 0.94% |
| 2074 | 8,298,947.37 | 899,845,238.18 | 0.92% |
| 2075 | 8,191,168.83 | 908,144,185.55 | 0.90% |
| 2076 | 8,086,153.85 | 916,335,354.38 | 0.88% |
| 2077 | 7,983,797.47 | 924,421,508.22 | 0.86% |
| 2078 | 7,884,000.00 | 932,405,305.69 | 0.85% |
| 2079 | 7,786,666.67 | 940,289,305.69 | 0.83% |
| 2080 | 7,691,707.32 | 948,075,972.36 | 0.81% |
| 2081 | 7,599,036.14 | 955,767,679.68 | 0.80% |
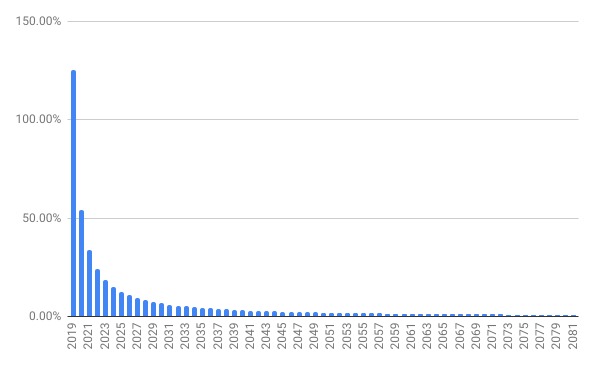
The chart below shows the maximum annual inflation of SwiftCash in the next 60 years! This is based on the assumption that each month, the ceiling for the budget is reached and the maximum monthly budget allowed to be mined, is actually mined! This is not a very likely scenario based on our experience. Last month for example, we only mined about 40% of the ceiling and this month, we're only going to mine less than 5% of the ceiling! This is why our whitepaper shows an estimate inflation based on the assumption that we consistently fail to use 30% of the maximum block rewards or in other words, we consistently only use between 55-60% of the monthly budget! And as you can see, we have not even hit that target in our recent history!
SwiftCash — Maximum inflation up to year 2081

| Year | New Supply(Max) | Initial Supply(Max) | Inflation(Max) |
|---|---|---|---|
| 2019 | 98,209,523.81 | 78,200,000.00 | 125.59% |
| 2020 | 95,563,636.36 | 176,409,523.81 | 54.17% |
| 2021 | 91,408,695.65 | 271,973,160.17 | 33.61% |
| 2022 | 87,600,000.00 | 363,381,855.83 | 24.11% |
| 2023 | 84,096,000.00 | 450,981,855.83 | 18.65% |
| 2024 | 80,861,538.46 | 535,077,855.83 | 15.11% |
| 2025 | 77,866,666.67 | 615,939,394.29 | 12.64% |
| 2026 | 75,085,714.29 | 693,806,060.95 | 10.82% |
| 2027 | 72,496,551.72 | 768,891,775.24 | 9.43% |
| 2028 | 70,080,000.00 | 841,388,326.96 | 8.33% |
| 2029 | 67,819,354.84 | 911,468,326.96 | 7.44% |
| 2030 | 65,700,000.00 | 979,287,681.80 | 6.71% |
| 2031 | 63,709,090.91 | 1,044,987,681.80 | 6.10% |
| 2032 | 61,835,294.12 | 1,108,696,772.71 | 5.58% |
| 2033 | 60,068,571.43 | 1,170,532,066.83 | 5.13% |
| 2034 | 58,400,000.00 | 1,230,600,638.26 | 4.75% |
| 2035 | 56,821,621.62 | 1,289,000,638.26 | 4.41% |
| 2036 | 55,326,315.79 | 1,345,822,259.88 | 4.11% |
| 2037 | 53,907,692.31 | 1,401,148,575.67 | 3.85% |
| 2038 | 52,560,000.00 | 1,455,056,267.98 | 3.61% |
| 2039 | 51,278,048.78 | 1,507,616,267.98 | 3.40% |
| 2040 | 50,057,142.86 | 1,558,894,316.76 | 3.21% |
| 2041 | 48,893,023.26 | 1,608,951,459.61 | 3.04% |
| 2042 | 47,781,818.18 | 1,657,844,482.87 | 2.88% |
| 2043 | 46,720,000.00 | 1,705,626,301.05 | 2.74% |
| 2044 | 45,704,347.83 | 1,752,346,301.05 | 2.61% |
| 2045 | 44,731,914.89 | 1,798,050,648.88 | 2.49% |
| 2046 | 43,800,000.00 | 1,842,782,563.77 | 2.38% |
| 2047 | 42,906,122.45 | 1,886,582,563.77 | 2.27% |
| 2048 | 42,048,000.00 | 1,929,488,686.22 | 2.18% |
| 2049 | 41,223,529.41 | 1,971,536,686.22 | 2.09% |
| 2050 | 40,430,769.23 | 2,012,760,215.63 | 2.01% |
| 2051 | 39,667,924.53 | 2,053,190,984.86 | 1.93% |
| 2052 | 38,933,333.33 | 2,092,858,909.39 | 1.86% |
| 2053 | 38,225,454.55 | 2,131,792,242.72 | 1.79% |
| 2054 | 37,542,857.14 | 2,170,017,697.27 | 1.73% |
| 2055 | 36,884,210.53 | 2,207,560,554.41 | 1.67% |
| 2056 | 36,248,275.86 | 2,244,444,764.94 | 1.62% |
| 2057 | 35,633,898.31 | 2,280,693,040.80 | 1.56% |
| 2058 | 35,040,000.00 | 2,316,326,939.11 | 1.51% |
| 2059 | 34,465,573.77 | 2,351,366,939.11 | 1.47% |
| 2060 | 33,909,677.42 | 2,385,832,512.88 | 1.42% |
| 2061 | 33,371,428.57 | 2,419,742,190.30 | 1.38% |
| 2062 | 32,850,000.00 | 2,453,113,618.87 | 1.34% |
| 2063 | 32,344,615.38 | 2,485,963,618.87 | 1.30% |
| 2064 | 31,854,545.45 | 2,518,308,234.25 | 1.26% |
| 2065 | 31,379,104.48 | 2,550,162,779.71 | 1.23% |
| 2066 | 30,917,647.06 | 2,581,541,884.18 | 1.20% |
| 2067 | 30,469,565.22 | 2,612,459,531.24 | 1.17% |
| 2068 | 30,034,285.71 | 2,642,929,096.46 | 1.14% |
| 2069 | 29,611,267.61 | 2,672,963,382.17 | 1.11% |
| 2070 | 29,200,000.00 | 2,702,574,649.78 | 1.08% |
| 2071 | 28,800,000.00 | 2,731,774,649.78 | 1.05% |
| 2072 | 28,410,810.81 | 2,760,574,649.78 | 1.03% |
| 2073 | 28,032,000.00 | 2,788,985,460.59 | 1.01% |
| 2074 | 27,663,157.89 | 2,817,017,460.59 | 0.98% |
| 2075 | 27,303,896.10 | 2,844,680,618.49 | 0.96% |
| 2076 | 26,953,846.15 | 2,871,984,514.59 | 0.94% |
| 2077 | 26,612,658.23 | 2,898,938,360.74 | 0.92% |
| 2078 | 26,280,000.00 | 2,925,551,018.97 | 0.90% |
| 2079 | 25,955,555.56 | 2,951,831,018.97 | 0.88% |
| 2080 | 25,639,024.39 | 2,977,786,574.53 | 0.86% |
| 2081 | 25,330,120.48 | 3,003,425,598.92 | 0.84% |
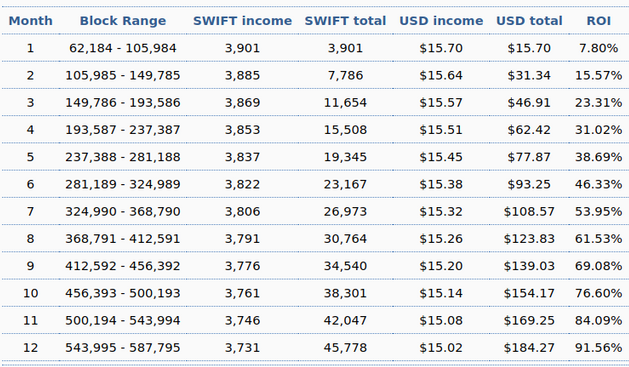
While the minimum inflation that goes to Miners and/or Masternodes is appx. 37% right now, if you click on the ROI section of our explorer, you will notice that the ROI for Masternodes is about 90% at the moment! How can that be? You might ask. It's really simple. The reason Masternodes can earn more than the inflation of the network is because not every stakeholder runs a Masternode! And some don't even participate in mining! Which results in more rewards for those who do participate. But the overall inflation of the network remains consistent and slowly shrinks as planned.
SwiftNode income in 12 months, as of Thursday, 28th of March 2019

Another thing you might want to look into before investing in a cryptocurrency is the initial distribution of block rewards. Some cryptocurrencies like Bitcoin started with zero supply but in the early days, almost nobody knew about Bitcoin and so most blocks were mined by those who knew, while inflation was almost infinite due to the initial supply being zero! With SwiftCash however, the initial distribution was airdrops on another blockchain, kind of like Bitcoin Cash, with the difference that problematic addresses were not airdropped and those who did not claim the airdrop within the first few months, were also removed. For more details on this, make sure you check out our whitepaper!
Furthermore, when you look at Bitcoin, you see that almost 80% of its maximum supply has already been mined by its 10th anniversary. Or when you look at Litecoin, you see that almost 70% of its maximum supply has already been mined within 8 years! With SwiftCash however, after 10 years, only 10-20% of maximum supply will be mined and SwiftCash in its 10th anniversary, will have 80-90% of its maximum supply yet to be mined! So potential future adopters and miners will not feel like they've missed out as much as they might, when it comes to things like Bitcoin or Litecoin!
Excellent analysis. I love Swiftcash and wish a bright future.
Posted using Partiko Android
This post is supported by $18.2 @tipU upvote funded by @smartcash :)
@tipU voting service instant upvotes | For investors.
Have to admit of all the cryptos this is my favorite to mine with the discord mobile mining!
Defended (11.98%)
Summoned by @swiftcash
Sneaky Ninja supports @youarehope and @tarc with a percentage of all bids.
Everything You Need To Know About Sneaky Ninja
woosh