Chinese new year presents????!! South Korean Fud??!!! Whales moving the market???!!! Alien invasion??!!!
Cryptobuzz #4
Chinese new year presents????!! South Korean Fud??!!! Whales moving the market???!!! Alien invasion??!!!
Lets look at the charts shall we?
2015 going into 2016
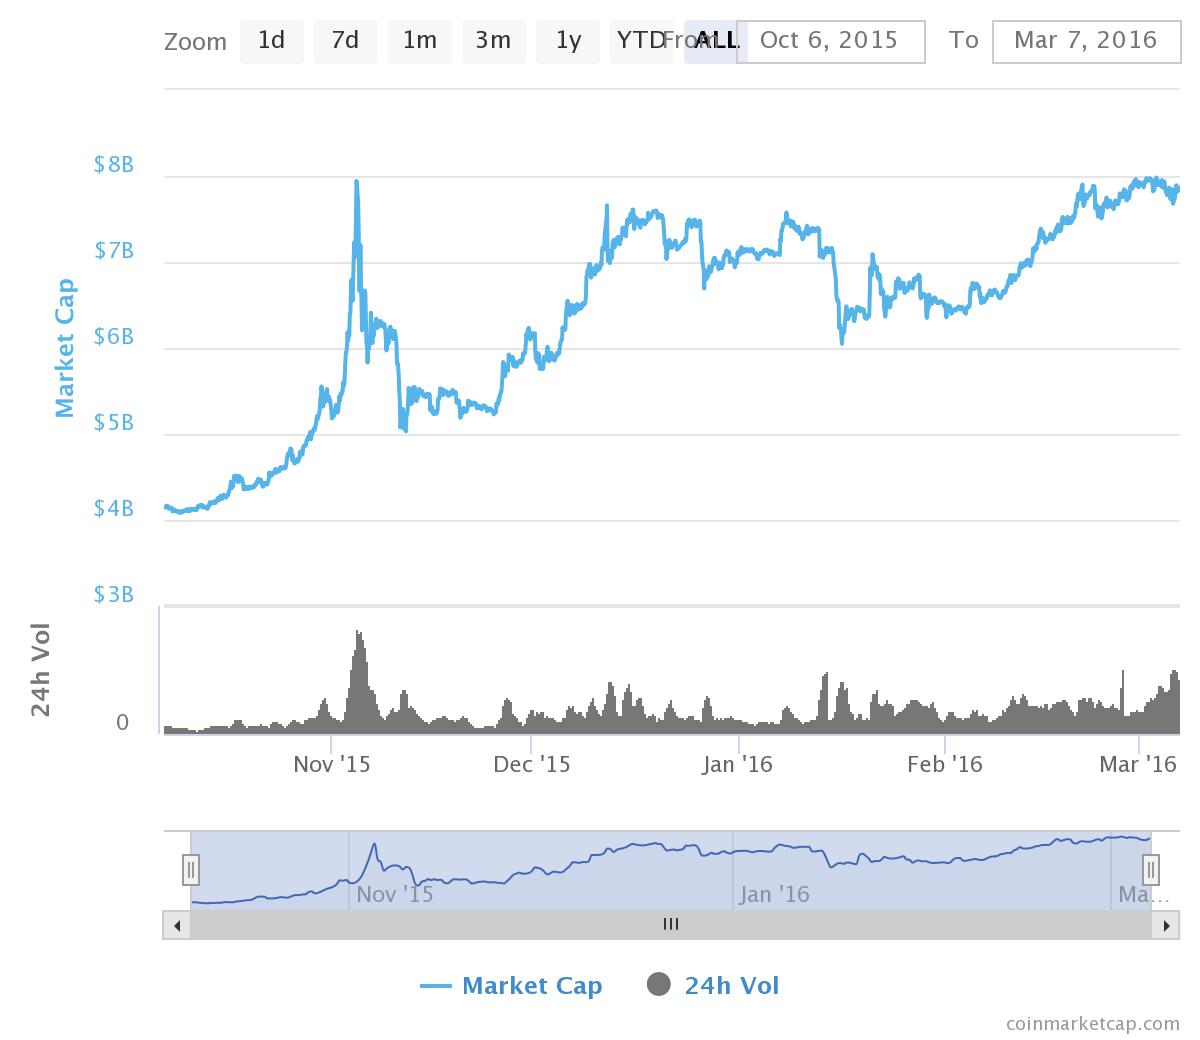
Oct 9th, 2015 - Market Cap is about 4.1 Billion…
From that point on you can see a pretty steady move up with a few corrections here and there until November 1st.
Nov 1st - Market Cap is about 5.1 Billion, and from that point there is a meteoric rise to about 7.8 Billion on Nov 4th. After that you can see an almost equally meteoric fall back to 5 Billion Market Cap on Nov 11th, which occurs in 2 steps. Not as sharp as the way up beforehand…the market cap “hangs out” in the 6 Billion area for a few days before falling further.
What do we see after that? A rather steady trend up, with some corrections here and there.
The next big run occurs from Nov 25th (5.2 MC) until about December 19th (7.5 MC). There is a high on December 12th before that, which I don’t count because there is a very quick correction followed by another run up.
What happens after that? Once again…a 2 step movement down from December 19th (7.5 MC) to December 26th (6.6 MC), which is right around Christmas time. After that we have a run up into the first week of January (8th) to 7.5 MC and what happens after that? Boom! A sharp fall down to 6.1 MC on Jan 16th. The market goes up and down until about
Feb 6th at which point a clear uptrend begins, which continues until March 13th with no major falls.There are major runs up and down after that, but we will leave it for now as we are trying to take a look at a time frame a few months before and after the beginning of the year.
Lets talk percentages. These are rough estimations.
Nov 1st-4th = 52% Rise
Nov 4th-11th = 36% Fall
Nov 25th-9th = 44% Rise
December 19th-26th = 13% Fall
and back 13% Rise on Jan 8th.
After that a fall of 19% by Jan 16th.
So lets remember the last number. 19% fall by Jan 16th.
2016 going into 2017
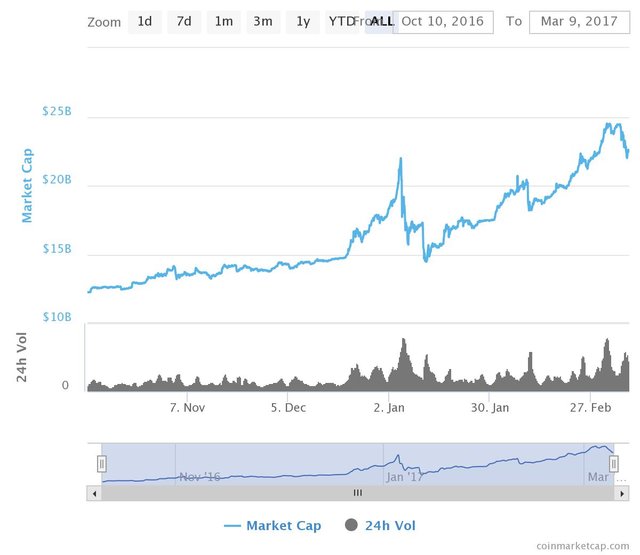
Pretty flat line from Oct 10th (12.2 MC) until about Dec 20th (14.7 MC). So it may appear flat but there is a slow increase of the market cap. Dec 21st - Dec 24th a small run up to 16.7 MC and a relatively small correction to 15.8 MC by December 26th.
What happens after that? A crazy run up until Jan 5th (21.8 MC) and an even sharper 2 step fall after that first to 15.8 MC on Jan 7th then a further fall all the way to 14.5 MC by Jan 12th. After that, a steady uptrend with a few corrections (pretty big one on Feb 9-10th), but back up after that. Noticing any similarities yet?
Percentages:
First sharp (ish) run up (Dec 21st-24th) = 13% Rise.
Small correction after (5%) Fall
Then a big run up = (37%) Rise
and after that a fall almost as big on Jan 12th = 34%
Remember that number. 34% Fall by Jan 12th.
2017 going into 2018 - aka present times
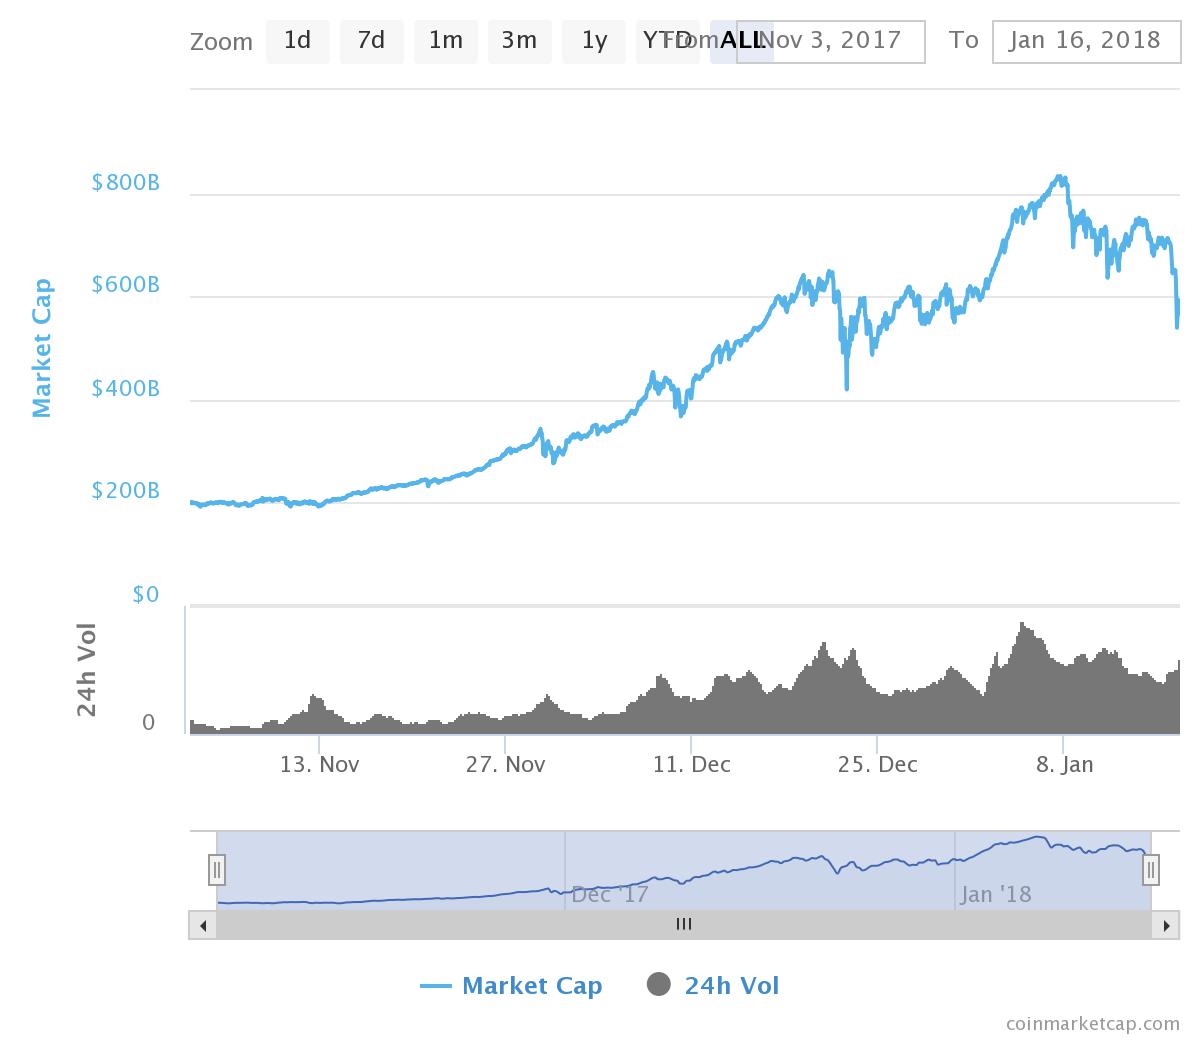
Relatively flat line until Nov 12th (197 MC). Once again, “relatively flat” is an oversimplification but please bear with me.
A pretty nice run up by November 29th to (332 MC). Small correction then a further sharper run up with some corrections to a high point on December 21st (639 MC). Immediately followed by a sharp correction to 435 in a day! (Dec 22nd).
Some small ups and downs after, then another sharp run up from Jan 1st (595 MC) to an all time high of 830 MC on Jan 8th….you all know what happens after that. Row, row, row your boat gently down the stream (well maybe not that gently). So yeah…a 2 step fall to the current market cap of 589 Billion (at the time of writing).
Percentages:
First sharp run up - a wooping 92% rise by December 21st!
Immediately followed by a 32% correction.
Ups and downs, with a general uptrend of 36% by Jan 1st.
Craaaazy run up of 39% to an all time high of 830 MC.
Finally…the current “market crash” of 30% down to 589 Billion.
Jan 17th update: We are currently at a Market Cap of 423 Billion which is
about 49% fall from the all time high on Jan 8th (830 MC)
Now, I don’t know if that’s just me, and I am by no means an expert, but it seems there are some pretty clear repeating patterns here. Now. 49% is pretty harsh but what goes up really fast? Goes down pretty fast, but from the previous years the market seems to be finding a "calm" point pretty soon, from which it gradually starts to climb up again.
So take a breath people! HODL, reinforce your positions or buy some coins while they are cheap. I remain optimistic. Happy investing!
p.s
On September 2nd of 2017, there was a similar situation with FUD from China.
The market then fell from 178 Billion on Sep 2nd to 97 Billion by Sep 15th, which represents a fall of 46%
It took about a month for the market to fully recover and go back to the same area (175 Billion) by Oct. 15th.
Hi. I am @greetbot - a bot that uses AI to look for newbies who write good content!

Your post was approved by me. As reward it will be resteemed by a resteeming service.
Resteemed by @resteembot! Good Luck!
The resteem was paid by @greetbot
Curious?
The @resteembot's introduction post
Get more from @resteembot with the #resteembotsentme initiative
Check out the great posts I already resteemed.