You are viewing a single comment's thread from:
RE: Bitcoin (BTC) Morning Update: More Detailed Explanation of Triangle vs Bear Flag
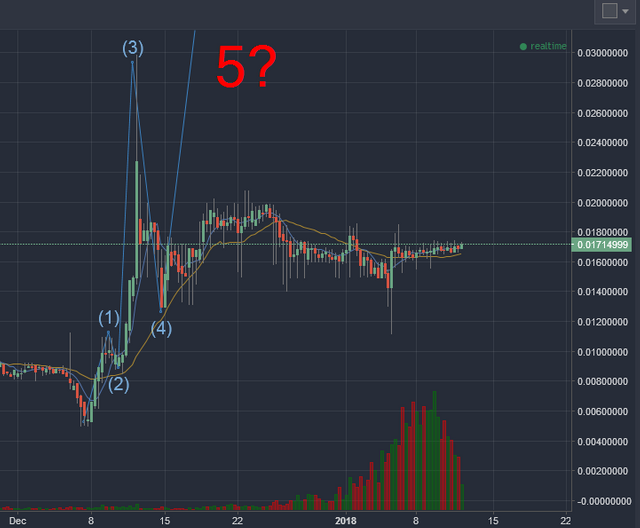
@haejin can you help me understand something? First off, I can't thank you enough for your analysis and lessons. I've learned so much, and have made MASSIVE profits - all thanks to learning about TA from you. My question is about LTC. Looking at the daily or 8 hour chart I see the 1, 2, 3, and 4 Elliot waves that brought it way up to over $200. I missed out on most of wave 3, but I got myself lined up and ready for wave 5 but it hasn't happened.
I'm sure that this doesn't "disprove" anything, and there's just something that I don't yet understand and I'm hoping that you can help me learn.
I believe you mixed (3) with (5). you have a very obvious correction in front of you, thats already an indicator. and for counting the subwaves that would confirm (1) and (3) you simply need a higher resolution.
also you clearly struggle when it comes to label the correction, and thats because you cant rely entirely on EW but must apply pattern-recognition as well.
I can accept that, but where do you see the 1 and 2?
Interesting. Is that a daily chart?
yes
i didnt open the chart but from your screenshot i would say that 1 & 2 are correct, simply change the postion of 3 & 4 and put 5 on the top
Also, the man himself called it wave 3. I know that he has revised waves before, but it really does seem to look like wave 3.
Post from last month: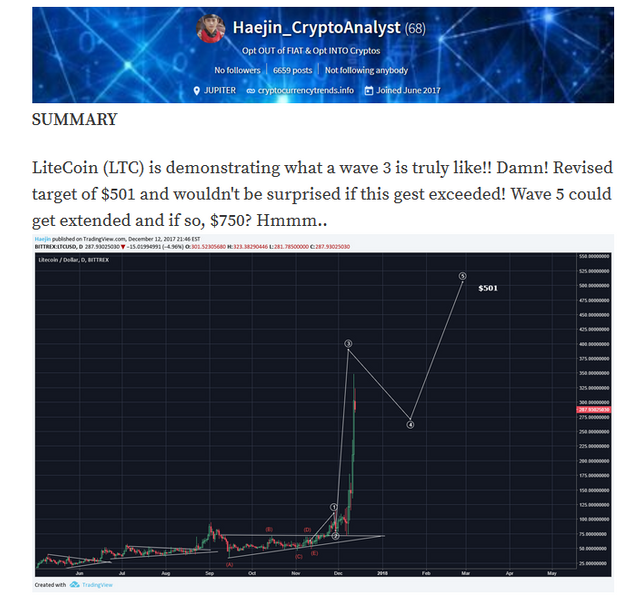
that's why I don't like to strech the 3 to much, I always use the 1,61 fibonnacci and when price is near that point I keep an eye open.
one main lesson you should have learned by now is to remain flexible.
anyway seems haejin quit nailed it with his call and I guess the reason why haejin has chosen not to put (3) lower is that it might almost be shorter then (1), so from this perspective I would agree with his count as well.
maybe some more inputs from the community?
Input from the community would be great! Upvote my original post to get some more visibility. I upvoted yours, so I'm not just out for the steembux
done :-)
That's how I see LTC in the long run.
https://steemit.com/bitcoin/@macmanux/ltc-btc-pair
When it come to the original question, I would count the waves like so on LTC USD.
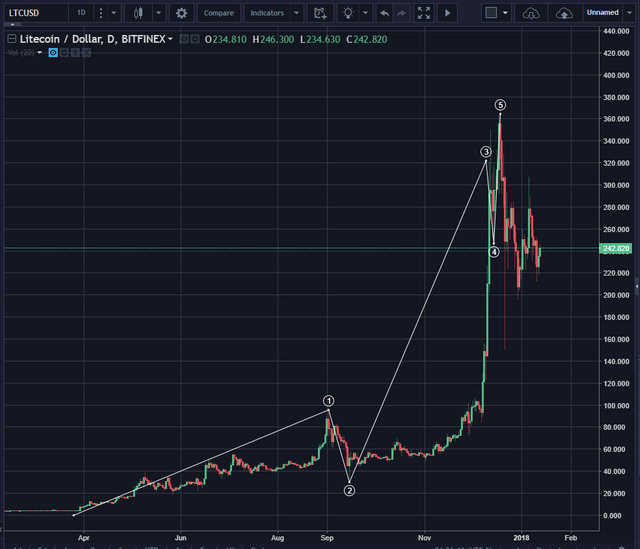
Notice that this gives the whole pattern the right look with wave 2 retracing about 50% of 1. Wave 3 is extended and 5 is 1.216 (time) the length of 1.
Thanks mate
What's your long-run view look like now, out of curiosity?