You are viewing a single comment's thread from:
RE: DIGIBYTE (DGB) Update: Take a BYTE out of a BULL?
@haejin I produced this chart at about 530 this morning. It fits directly to form. I have seen these alternating right triangles in many coins, pointing to a likely turning point for the price point, or at least a change in pattern at the peak. What do you think?
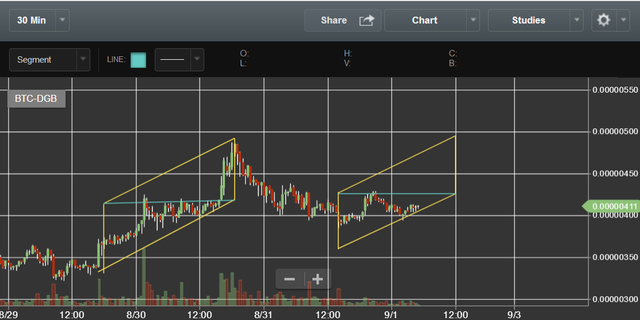
and here is the playout this morning.....
I mean, it hit the price, the time, broke the line at the exact right time. I'm somewhat proud of myself!
These are called fractals which are based on the fibbonacci golden ratio on pattern and thus EW also is fib based. Nice job!
Thank you, I am very keen on being able to spot fractals actually (maybe too many hallucinogens, or just the right amount when I was a bit younger!). I have never fully studied using fib to trace....I mean I understand it, but I see the fractals in the chart, spirals throw me off!
Both EW and fib seem useful, but personally, mapping out sentiment makes far more sense....to me anyway. Using Fib relies on that formula always being correct. Whereas I see EW as not making assumptions based on previously used designs, but rather coming to educated guesses based on previously studied sentiment. Reminds me of good ole Terence McKenna using formulas and fractal compaction on a timeline to measure novelty in the universe. While his theories can of course be argued, as any can, his fractal breakdown of novelty in the world was quite bizarrely accurate. Compacting, compacting compacting....then booom, start it again, but cram it into a smaller space this time. Sounds really familiar to watching these trends.