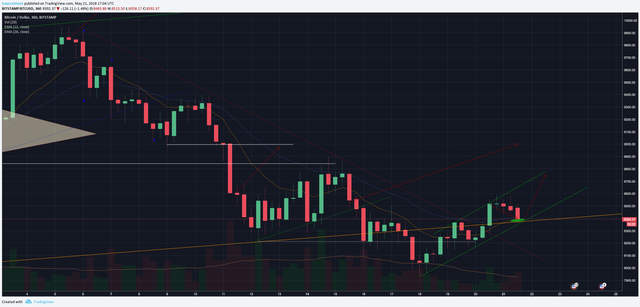
BTC:USD 4 hour chart DAILY UPDATE (day 85)
Yesterday I warned against buying resistance at $8,500 - $8,600 and I also set up a potential entry at $8,736 where we would find horizontal and trend support. Furthermore, I advised to watch out for a bullish crossover on the 12 & 26 days EMA’s (6 hour chart) as confirmation.
We haven’t quite gotten the EMA cross, but it appears imminent at this point. I made my first entry at $8,376 for ¼ of my trading roll and plan to add on after further confirmations. I will be closely watching for moving average crossovers as well as a breakout from the daily Ichimoku Cloud .
In order to enter another full on bull market we need to see a crossover on all timeframes and then high we need to see the longer term moving averages cross (50 & 200 specifically). We also need to be trading above a green cloud. We are not out of the woods until all of those boxes are checked.
My plan is to add onto my position by 2/4 of my trading roll if and when the 12 & 26 day MA’s cross on the daily chart and then add the final ¼ when/if we break out of the cloud on the daily chart .
Stop loss will be actively managed and is tentatively set slightly under $8,150.
Happy trading and remember that following is free!
Want even more?
Check out the Brand New Projections for the Bitcoin 2018 Bull Trend - $34,000 Target?!?!
Click here for yesterday’s post!
Here the 0.1 > 1 BTC Trading Challenge!
And you definitely don’t want to miss the next Gold Bubble!
White Paper Cliff Notes

