BTC:USD 4 hour chart DAILY UPDATE (Day 77)
Disclaimer: This is not meant as financial advice and is for entertainment purposes only.
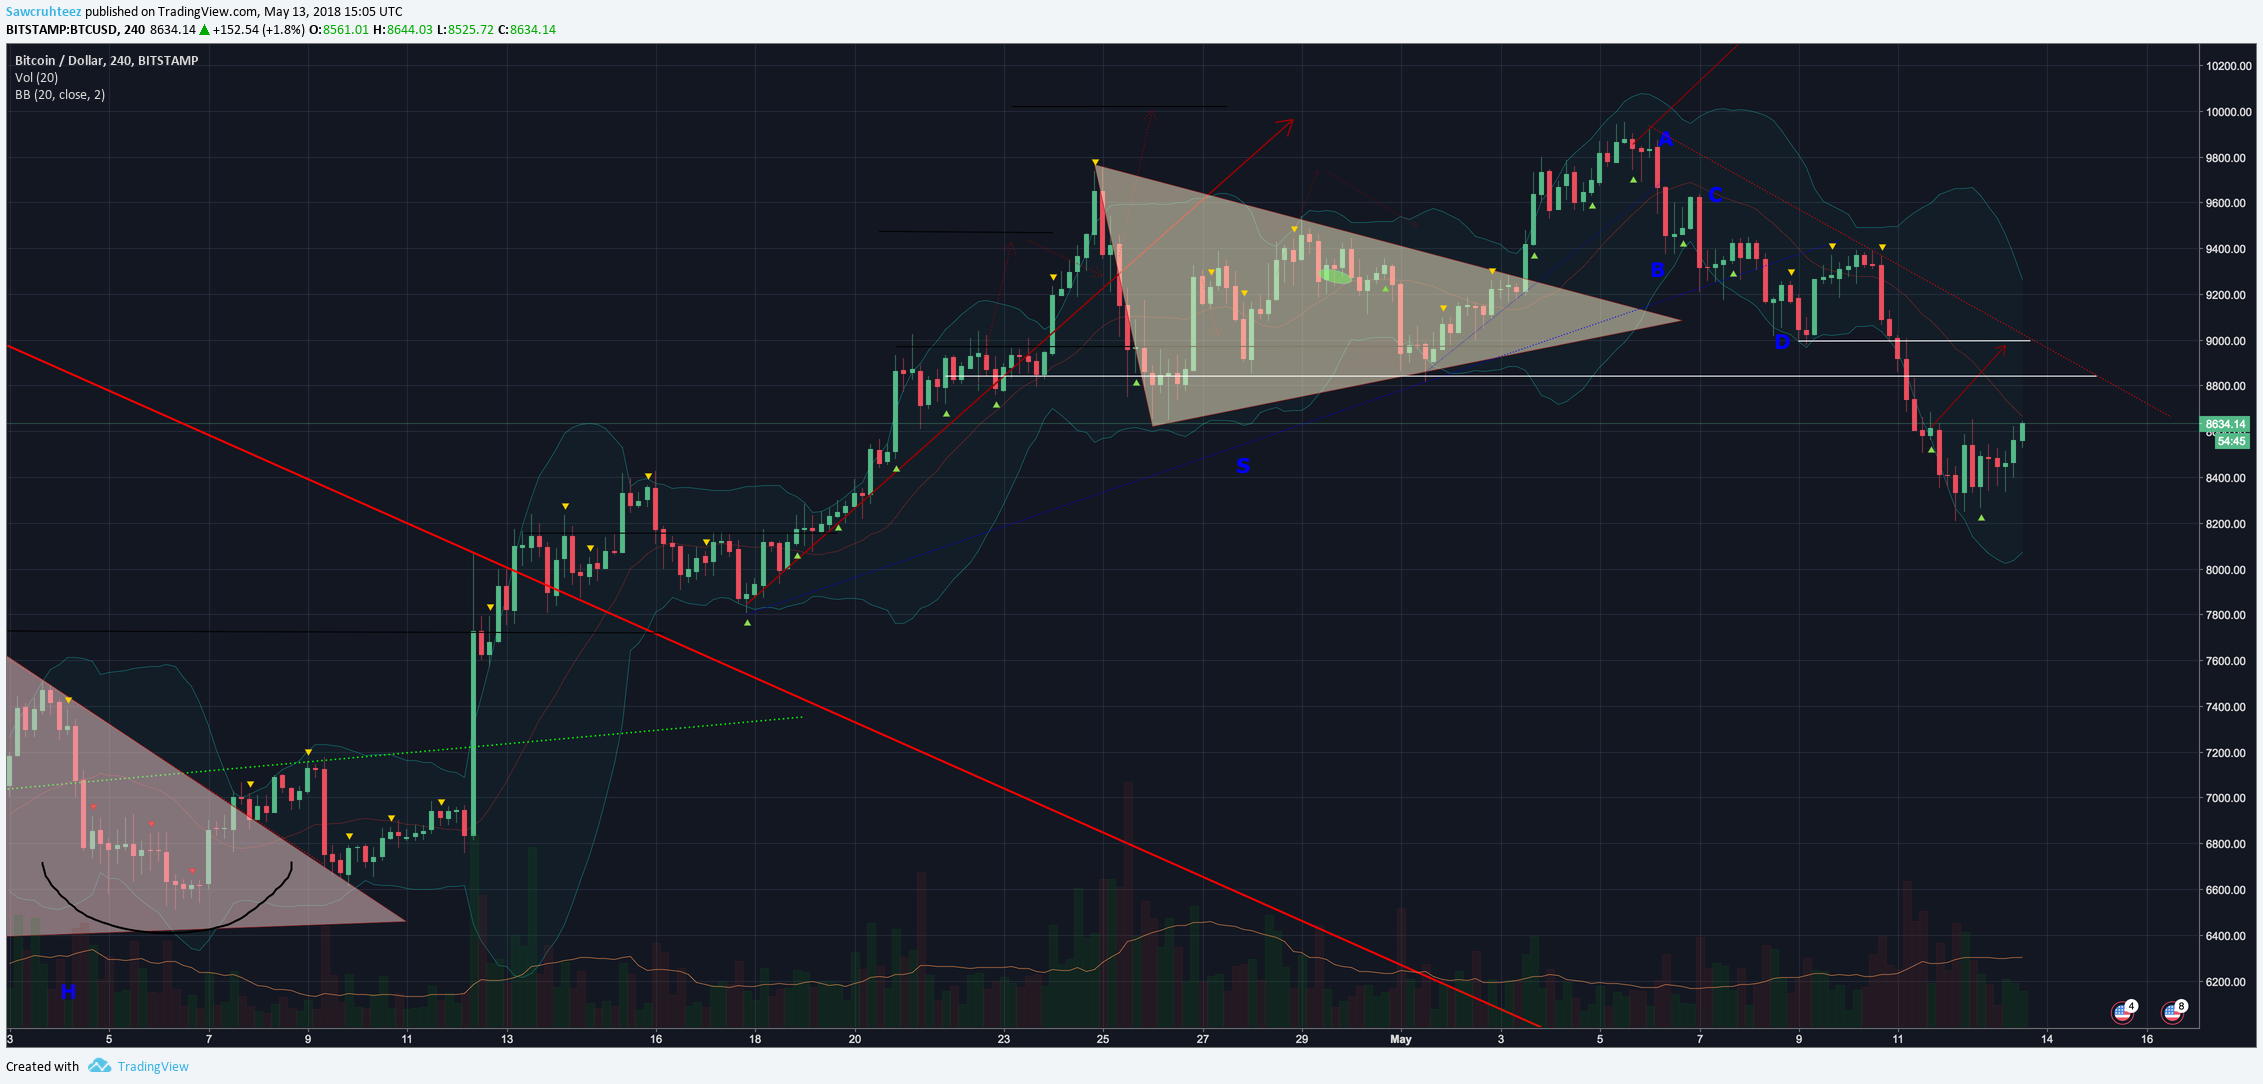
Yesterday I was holding onto my long from ~$8,615 and was very confident that we would either get a bounce off $8,200 or find a range. I felt good about that due to how far away we had fallen from the 12 & 26 day moving averages. That was confirmed with a few candles closing outside of the Bollinger Bands .
Now that we have cooled off a little bit I am keeping a very close eye on how we develop from here. I expect there to be significant resistance waiting at $8,600 - because there was a decent amount of volume at the price before we broke down further.
That price will also see us testing the 12 day MA as well as the simple moving average in the middle of the Bollinger Band . It will be time for me to exit this trade if we face too much resistance. Stop loss is currently set under $8,300 but it will be actively managed.
On the other hand if we breakthrough then it could be a quick rally up to $8,850. This is where the profit target has been adjusted to. That is due to prior horizontal resistance (white line) as well as the third point of a down trend (red dotted line). Not the best risk:reward on this trade, but sometimes things change and you have to play the hand that is dealt.
Happy trading and go bulls!

Click here for yesterday's post
Here for the 0.1 > 1 BTC Trading Challenge
And you definitely don't want to miss the next Gold Bubble!