Bitcoin Daily Update (day 188)
I believe that it is possible to beat the market through a consistent and unemotional approach. This is primarily achieved through preparing instead of reacting. Click here to learn more about the indicators I use below and click here from my comprehensive trading strategy. Please be advised that I swing trade and will often hold onto a position for > 1 month. What you do with your $ is your business, what I do with my $ is my business.
1 - 6 days: < $6,000 | 1 month predictions: < $5,750 by 9/24 | bottom prediction: $3,000 by 10/30
Previous analysis/position: “50% of my position was entered yesterday. Almost everything is going according to plan. The sharp reversal in the btcusdshorts is giving me a cause for concern.” / Short ETH:USD at $296.32 & short ETH:BTC at 0.04147 | 50% entered
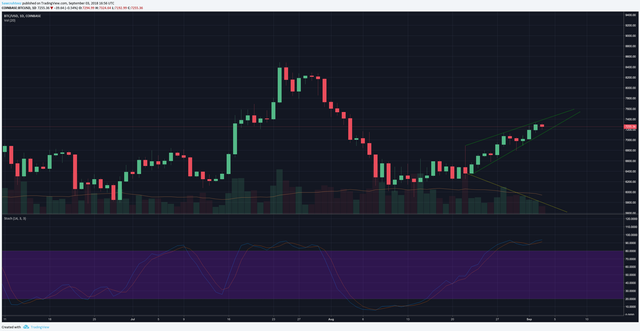
Patterns: Rising wedge (bearish) inside a descending triangle (bearish)
Horizontal support and resistance: Supporting $7,190 (do not expect it to last long) | R = $7,284 - $7,321
BTCUSDSHORTS: Forming hanging man after huge spike. @CryptoCore had a great tweet yesterday explaining why he thinks the spike occurred. He outlined several sell signals that were triggered and said that the bots jumping on those positions is what caused the spike. A few more levels were outlined above that he thinks will cause a similar reaction.
Funding Rates: Longs pay shorts 0.01%
12 & 26 EMA’s (calculate % difference): 12 = +5.43% | 26 = +5.72%
50 & 128 MA’s: 50 = +2.87% | 128 = Currently being tested for resistance. Should be a strong indication either way (if resistance or if breakthrough). If price gets stuck between 50 & 128 then gets a crossover it could be the first sign that we are out of the bear market (do not expect this to happen).
Volume: Price has been rising on low volume since 8/28 - provides confirmation of rising wedge.
FIB’s: 0.382 = $7,417 | 0.5 = $7,119
Candlestick analysis: Daily hanging man forming.
Ichimoku Cloud: Cloud is attempting to hold as resistance. Price has peaked into it but hasn’t staying inside long.
TD Sequential: Green 3 after sell setup was reset. Weekly green 2.
Visible Range: Hugging top of volume area with anything under a 4 month lookback. High volume nodes from $7,000 - $8,500 indicates strong resistance ahead.
BTC Price Spreadsheet: 12h = +/- 0 | 24h = +0.55% | 1w = +5.07% | 2w = +12.13% | 1m = -3.67%
Bollinger Bands: Pulling back from top band, MA at $6,700 should get retested.
Trendline: Rising wedge
Daily Trend: Chop
Fractals: UP = $7,126 (should get another one on top of yesterday’s candle) | DOWN = $6,781
On Balance Volume: Pulling back, could create bearish div over next 1-2 days.
ADX: Daily ADX threatening to cross 20.
Chaikin Money Flow: Overbought on daily and starting to pull back. Bear div’ on weekly.
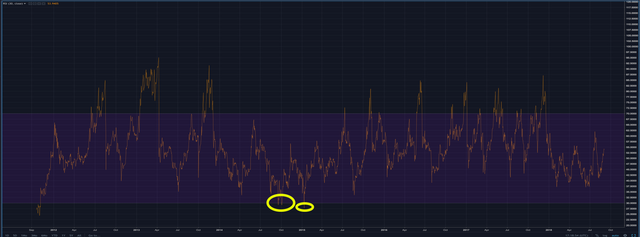
RSI (30 setting): W = 50.4 | D = 53.7 | Very confident that RSI needs to be oversold (< 35) before we find a bottom.
Stoch: Overbought on daily and just made a bullish re cross. Bullish on weekly.
Summary: There are a few factors that have made me reconsider my bearish position: btcusdshorts and price starting to squeeze in between 50 & 128 MA’s for a potential bullish crossover.
However, I trust the patterns and I trust that we are still in a bear market. The rising wedge should come to completion well before the price creates a higher high above $8,500 and that pattern is expected to break to the downside.
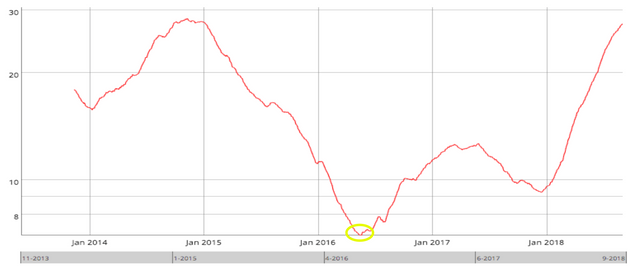
The Network-to-Transaction-Value remains severely overvalued. Waiting for that to retrace to support levels as well as the RSI getting oversold are two of my most objective/reliable indicators of a bottom.
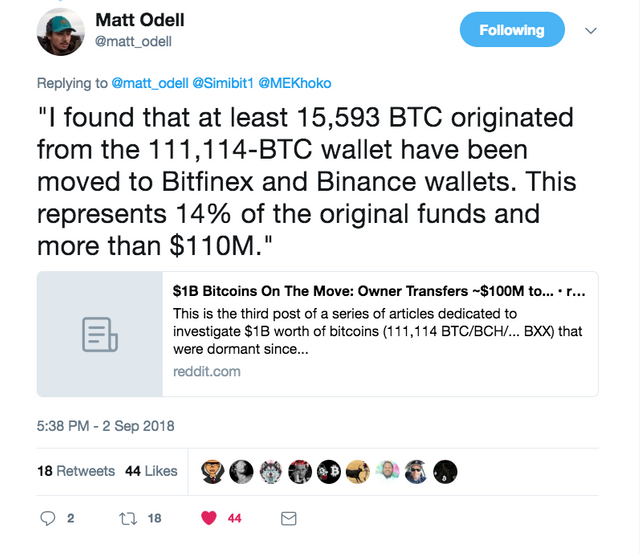
Another good indication will be the completion of the Mt Gox sale. I am expecting over 15K Mt Gox coins to hit the market in the next week or so. Per a tweet from @matt_odell:
Another entry just triggered on ETH:BTC when it broke down 0.04 - now I am 68% entered. Will be waiting for further confirmation to enter last 32%.
Thanks for reading!
Allow me to Reintroduce Myself...
Learn How to Trade! [part 1]
Learn How to Trade! [part 2]
Wyckoff Distribution
Bitcoin Daily Update (day 187)


Stochastics are overbought on the following time frames: 1h, 2h, 4h, 6h, 12h, 1d. There are also bearish divergences on the 4h and 12h. A short term correction is expected. If that correction breaks down the rising wedge then a medium - long term correction is expected (1w - 6w).
Coins mentioned in post: