Learn How to Trade! [part 2]
I plan out my trades through in depth technical analysis , risk management and market research. I believe that consistency is the most important factor in regards to trading profitably. A traders success is determined more by the consistency of their approach than it is by the quantity or quality of indicators being used. Over the long run, a consistent process combined with a sound strategy will net a disciplined trader far greater returns than the market average.
IMPORTANT NOTE: If you are looking for a shortcut then this is not for you! This is for individuals who are enthusiastic about putting in the time and effort but may lack the structure.
If you have any questions then feel free to leave a comment or send a private message. Comments are preferred in case others have the same question(s).
Click here for Part 1: 'Comprehensive Trading Process' where we took an in depth look at the indicators I use.
In this post we will get into the nuts and bolts of my trading strategy. We will go over: how to identify a trend, time horizons, rules of thumb, risk:reward, stop losses, profit targets, profit taking and which indicators to use in a bear market vs bull market.
Before Making an Entry
Identify Trend
Higher highs and higher lows = bull market
Lower highs and lower lows = bear market
Lower highs and higher lows = triangle continuation pattern
Equal highs and equal lows = Consolidation/Range
Price > Short term MA > Long term MA = Bull Market
Price < Short term MA < Long term MA = Bear Market
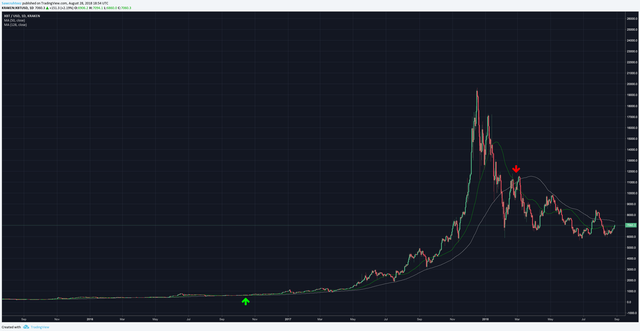
-I like to use the 50 & 128 day MA’s by default for crypto. For traditional markets I use the 200 MA.
-For short term price movements (1 month or less) I like to use exponential moving averages. 12 & 26 EMA for crypto and for traditional markets the 9 & 21 EMA.
Consensio can also be used to identify entries (bullish crossover) and exits (bearish crossover).Using this approach by itself on Bitcoin would have gotten you in at $653 on October 16th, 2016 on the was a bullish crossover and it would have gotten you out at $10,903 on February 24th 2018 on the bearish crossover. At that time a short sale could also be initiated.
Welles Wilder’s ADX
If ADX > 25 then trending market
If ADX < 20 then no trend is present
If +DI > -DI then bull trend
If -DI < +DI then bear trend
If +DI > -DI but ADX < 25 then not considered a bull trend because no trend is present. Instead I would consider it to be locked in a trading range will a bullish bias.
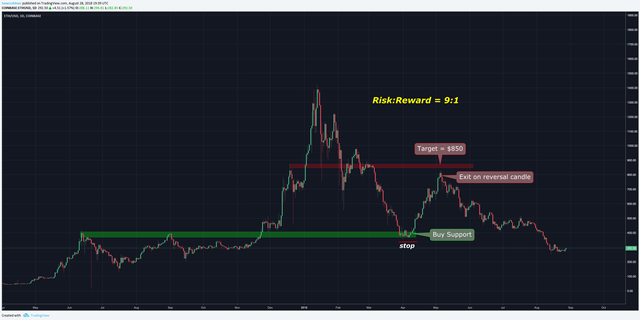
In extreme circumstances I will bet against the trend. This will only happen when the risk:reward is too favorable to pass up. Here is an example of when I made a big bet against the trend.
Prior highs are expected to be strong support on the first test. Combined with the price being oversold on every metric and a 9:1 risk:reward ratio this was took good to pass up. It pulled up right before my profit target but the reversal candle at resistance provided a good chance to get out before the correction.
Identify Time Horizon
Investment
Is this a 10+ year investment? If so then I will dollar cost average my way in and not even look at the charts and will only listen to the news sparingly. Investments are not meant to be babysat, they are meant to develop over time.
Bet it then forget it! This applies to Bitcoin more than any other asset I can think of.
Position Trade
Buy/sell breakouts and attempt to hold on for the duration of the trend. This is done through technical analysis and trailing stop losses. If I am in a position trade I will tend to it daily by looking at charts and managing stop losses. It is not required to ‘baby-sit’ the position by watching it all day and this approach is actively discouraged.
Position traders do not concern themselves with intraday movements. Managing the position too closely will often cause traders to make mistakes they wouldn’t have otherwise such as: taking profit too early or adjusting stop losses in the heat of the moment.
This is my preferred method of trading for a number of reasons. Primarily it's because I think it is the most profitable way to trade. In addition I like to live a balanced life and prefer the ability to set my stop loss and forget about it while I am out playing golf, skiing or at the gym.
Time horizon for a position trade is often a couple months or even a year+. The Consensio example above is a prime example of a position trade.
Swing Trade
“Markets do not go straight up, nor do they go straight down.” There is an ebb and a flow to the price movements. Swing traders try to capitalize on the daily - weekly price movements. Is price at resistance? Sell. Is price at support? Buy.
Swing traders have well defined price targets. They can trade within ranges or in trending markets but they generally do not hold through significant resistance in order to speculate on the price movement. If it does breakthrough resistance then they can re enter without as much risk.
Day trade
Mostly scalpers and high frequency robots. In traditional markets the price generally isn’t very volatile on an intra-day basis so most traders will use high leverage. This will allow them to return 10%, 50% or even 100% a 1% price movement in the underlying asset.
In crypto the market is volatile enough for day traders to make a very handsome profit without using leverage. With or without leverage this approach is still extremely risky.
Rules of Thumb
The longer the time frame = the lower the risk
The shorter the time frame = the higher the risk
The higher the leverage = the higher the risk
The lower the leverage = the lower the risk
The stronger the market is trending the more comfortable I feel taking on risk, in terms of position size and time frame. When the market is trending and all of the time frames are lining up then I will make some day trades. However, this has not been the case in months and is not something I actively look for.
Risk:Reward
If Real Estate is ‘Location, location, location!’ then in trading it is ‘Risk:reward, risk:reward, risk:reward!’
For me it does not matter if it is shorting Bitcoin (my favorite asset) or longing a US financial stock (one of my least favorite), if the risk:reward is unbalanced enough towards my favor then I will take a position. If it isn’t a 4:1 bet then I have to be very, very certain in the direction of the market.
In order to understand this ratio I must write down my stop loss, and profit target(s) beforehand. The stop loss and profit targets are gospel! Changing them ruins the entire position. Lacking the discipline to stick to the stop loss/profit target in the heat of the moment = lacking what it takes to actively trade.
Stop Losses & Profit Targets
Stop losses are usually straightforward. In parabolic markets they can change, but they shouldn’t be much more difficult. One thing that may separate me from other traders is that I like to give my position plenty of room to develop.
I hate getting whipsawed on my trades! It is my least favorite feeling and one that has taught me many lessons.
I am extremely patient and cautious with my entries. I wait until I am very confident in my position and therefore I am comfortable giving it plenty of room to develop. I set it at a level where I know I will not want to adjust it if the market is moving against me. In fact I would probably do well taking the other side of the trade, a/k/a ‘flipping my position’ as soon as my stop loss is triggered. However I have a strict no re entry rule for a minimum of 24 hours after getting stopped out.
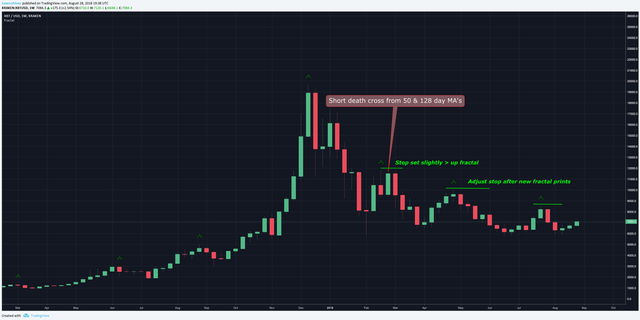
In bull markets I set it slightly under the prior low. I will use the weekly chart by default and then zoom in to see if I feel comfortable setting it a little tighter. In bear markets I set it slightly above the prior high. This is usually illustrated by ‘Bill Williams Fractals’.
I will trail my stop loss once a new high/low is established.
If I see a strong chance of a reversal then I may take partial or full profits instead of leaving it up to my stop loss. Such was the case with the ETH:USD long that didn't quite reach my target.
If the market has entered a phase 3 hyperwave, as defined by Tyler Jenks, then I will use the Parabolic SAR' instead of Bill Williams Fractals. On the weekly chart I will use the previous SAR as my stop and trail it as soon as a new one is printed. If using the daily chart I will set it two SAR’s behind and move it up one each time a new one is printed.
Taking Profit
Always taking partial profits, rarely making decisions for the full position. This is true when entering and this is true when exiting. It minimizes anxiety and emotions which allow you to make more effective decisions.
In Trending Markets: Take partial profits when a new high is created if/when you get signs of a reversal (Red 9 on TD sell setup or reversal candle). If still fully confident in position then can re enter that amount of a pull back. If trend appears to be reaching a point of exhaustion then it is important to lock in some profits.
In Parabolic Markets: I like to gamble on house money, it makes me feel much more comfortable about the draw downs. Here is an example for how to take profits in a parabolic market: If +100% then take 10%-20% off the table. If +100% again then take another 15%-25% off the table. Keep doing this as long as price is making all time highs.
Take full profit if phase 4 or phase 3 of hyperwave is violated and consider opening a short.
If weekly and daily RSI (with 30 setting) are > 80 then take full profit due to parabolic high risk (more below). If Welles Wilder’s ADX is > 50 on the weekly and/or > 60 on the daily then time to take full profit.
If Trading a Pattern: A chart pattern will indicate a profit target. If your reason for entering the trade was the chart pattern then do not get greedy with the profit target! Relying on a trailing stop will often cause a trader to miss out on a large part of the profit when trading a pattern.
Be very specific about what you are investing in long term/hodling and what you are using to trade.
If investing/hodling then put into cold storage and don’t do anything for a minimum of 10 years.
Best Indicators
I have noticed that some indicators work really well when the asset is at or near all time highs and other indicators work best when the market is recovering or in a bearish trend .
If ATH, or ATH territory
Tyler Jenks’ Hyperwaves: Help to identify areas of support in parabolic markets. Also indicates when the parabolic move is exhausted (phase 4 or phase 3 breakdown).
Hyperbolic burst: Use 30 period RSI . If >/= 70 then parabolic status. Prefer weekly and daily to be > 70 with W > D. If both weekly and daily are > 70 then in a Parabolic High Risk (PHR) state. If Weekly and Daily > 80 then Extreme Parabolic High Risk (ePHR).
Fractals/Parabolic SAR’s: Very useful for setting trailing stops and identifying a reversal in trend. Up fractals should not get broken in a down trend and down fractals should remain in tact while trending up. Broken fractals/sars are a strong indication of a reversal, especially on the weekly.
Ichimoku Cloud: Tenken-Sen serves as a high probability entry in trending markets. Kumo twists can help identify the end of a trend. The cloud can act as support. I find it to be most useful as a way to identify no trade zones. This occurs when the price is inside the daily cloud.
MA’s: Like to use 10MA - 50MA - 128 MA on the daily chart and the 7/30/50 on the weekly. If the 10 MA crosses the 50 then it is a good indication of upcoming consolidation and/or reversal.
Guppy MA's are also useful for identifying a reversal.
For Bitcoin
NVT: Most objective measurement we have to value the Bitcoin' blockchain. However, with the introduction of the Lightning Network and batching transactions I do not know if this will continue to work. For example: The blockchain could be getting used more but NVT could be showing the network as overvalued because there are less total transactions.
If Bear Market or Recovery
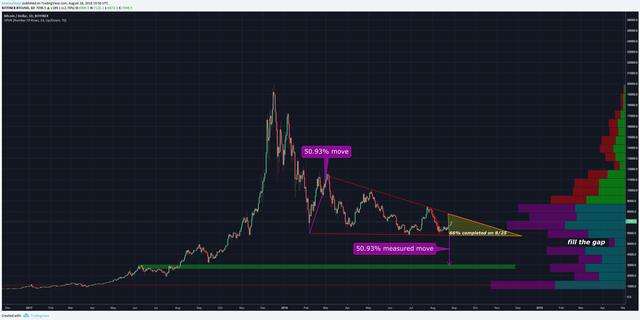
Horizontal support/resistance and/or FIB’s: Prior resistance turns into support. FIB’s can help identify major levels of support/resistance . Look for gaps that need to be filled.
VRPR: Large volume profile on top = large resistance | Large volume profile below = large support | If gap in volume below price then high probability that the asset will retest that zone, a/k/a ‘fill the gap’.
Patterns: Patterns can be very useful in identifying high probability entries and estimating profit targets.
Candlesticks: Capitulation and Euphoria wicks are a very strong indication of a reversal. I like to look for reversal candlesticks to be in confluence with an area of support, such as a horizontal, trend or Ichimoku Cloud.
Trendline: Can be very useful in identifying bottoms and catching trend reversals. If trend is violated and holds as resistance/support on a retest then it is a likely reversal. When the price is in a freefall using trendlines and/or hyperwaves can be useful in identifying key areas of support.
Due to the indicators used in bear markets I am predicting a $3,000 bottom for the price of Bitcoin on or around 10/30/2018 and will be opening a large short position on this bounce.
Do not look for a reason to enter a trade, look for reasons to stay out! Anyone can find a reason to enter a trade, and anyone can come up with an eloquent explanation to make the trade sound profitable. When you are actively looking for reasons to take the other side of your position and are coming up empty then it is probably time to bet big and use a generous stop loss!
Thanks for reading!
Learn How to Trade! [part 1]
Allow Me to Reintroduce Myself...


Love the tips regarding risk/reward and not looking for a reason to get in a trade. I’m not not an expert trader but these are great insights! Thanks!
Bravo
Exquisite guide man. Good work.
Billion Markets has attracted attention in 2025, but it carries notable risks. Users should be aware of regulatory measures affecting its operations, as oversight varies by region. This review highlights what users need to know before engaging with Billion Markets. The platform offers multiple trading options, yet volatility can lead to significant losses for inexperienced investors. Transparency regarding fees and withdrawal processes is mixed, requiring careful examination. For anyone considering this platform, understanding its regulatory environment and operational practices is essential.