Bitcoin Daily Update (day 182)
I believe that it is possible to beat the market through a consistent and unemotional approach. This is primarily achieved through preparing instead of reacting. Click here to learn more about the indicators I use below and click here from my full trading strategy. Please be advised that I swing trade and will often hold onto a position for > 1 month. What you do with your $ is your business, what I do with my $ is my business.
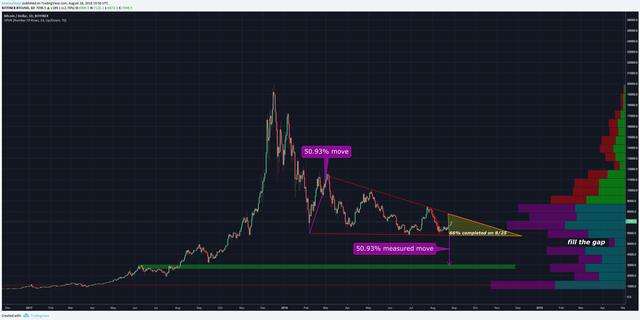
1 day - 1 week: short squeeze/test top of triangle at $7,500 -$7,650 | 1-2 weeks: Retest $6,000 | 1 month predictions: < $5,750 by 9/24 | bottom prediction: $3,000 by 10/30
Previous analysis/position: “If you are patient over the next few days/weeks then I strongly expect a favorable position to present itself. If we rally to $7,000 + then it will be a great selling opportunity.” / Sidelines
Patterns: Descending triangle
Horizontal support and resistance: S = $7,000 | R = $7,100
BTCUSDSHORTS: Brokedown horizontal and trend support. Should test for resistance at 30,400 for support
Funding Rates: Shorts pay longs 0.0021%
12 & 26 EMA’s (calculate % difference): 12 = +5.22% | 26 = +5.06% & posturing for bullish cross
50 & 128 MA’s: 50 = +1.43% (first time above since July 17th) | 128 = -4.60%
Volume: Unimpressive volume on breakout (below MA)
FIB’s: 0.5 = $7,161 | 0.382 = $7,462
Candlestick analysis: 4h doji just closed. Now forming a hanging man.
Ichimoku Cloud: Cloud and Kijun-Sen acting as resistance at $7,200. Shows strong resistance at $7,875. 4h cloud is bullish.
TD’ Sequential: Daily G6 indicates 3 days left to the upside. Price flip on weekly.
Visible Range: Low volume nodes from $7,100 - $7,275 with 1 month lookback.
BTC Price Spreadsheet: 12h = +2.3% | 24h = +4.33% | 1w = +8.89% | 2w = +12.55% | 1m = -13.83%
Bollinger Bands: Price has currently pierced through the top daily band.
Trendline: Descending triangle
Daily Trend: bullish
Fractals: Just broke up fractal. Next one is $8,307 | down = $6,230
On Balance Volume: Moving up with price/no div
ADX: Weekly is starting to turn down at 13. +DI diverging from -DI and ADX has pulled back under 20 on daily.
Chaikin Money Flow: Has turned down sharply on weekly after having a bull div’ for a while.
RSI (30 setting): W = 50.01 | D = 51.8
Stoch: Overbought on daily. Still plenty of room to go on 3d. Recently made bullish cross on weekly.
Summary: There is significant resistance from $7,000 - $7,500 and I would not be surprised to see the price bull back from anywhere in that range. Paying close attention to daily BB and Ichimoku Cloud as well as the lack of volume on the breakout so far.
The daily TD Sequential indicates 3 days left to the upside. Getting a perfected 9 on the sell setup would be ideal. Also will be watching for a reversal candle at horizontal resistance to indicate a good time to enter.
I will remain on the sidelines and wait for the best entry I can find. I expected this bounce to provide a great short selling opportunity and nothing has changed. I closed my ETH:USD shorts at $275 and will be happy to re open in the $300 range. I still think shorting alts is the best bet, they have been falling harder and faster that BTC - especially over the last 1-2 months.
If you have a question then leave a comment or send me a DM. Comments are strongly preferred in case others have the same question(s).
Allow Me to Reintroduce Myself...
Comprehensive Trading Strategy [part 1]
Comprehensive Trading Strategy [part 2]


