Bitcoin Daily Update (day 187)

I believe that it is possible to beat the market through a consistent and unemotional approach. This is primarily achieved through preparing instead of reacting. Click here to learn more about the indicators I use below and click here from my comprehensive trading strategy. Please be advised that I swing trade and will often hold onto a position for > 1 month. What you do with your $ is your business, what I do with my $ is my business.
(amended) 1 - 7 days: < $6,000 | 1 month predictions: < $5,750 by 9/24 | bottom prediction: $3,000 by 10/30
Previous analysis/position: “Believe that this weekend will be the best opportunity to re open shorts.” / Short ETH:USD at $296.32 & short ETH:BTC at 0.04147 > 50% entered
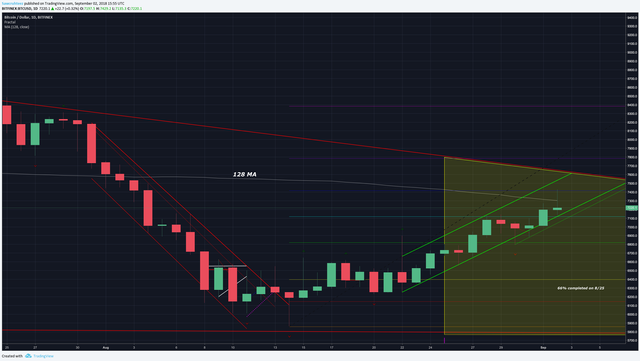
Patterns: Descending triangle
Horizontal support and resistance: S = $7,136 | R = $7,260 and $7,440
BTCUSDSHORTS: Have never seen anything like this. Went from 21,857 to 33,279 in 8 hours for an increase of 52.25% and the price hasn’t budged. In fact the price moved up despite that selling pressure. Points to one guy/fund making a huge bet and being in big danger of getting squeezed out at this point. Really thought price would be < $6,000 by the time shorts got back above 30K.
Funding Rates: Longs pay shorts 0.01%
12 & 26 EMA’s (calculate % difference): 12 = + 4.53% | 26 = +6.02%
50 & 128 MA’s: 50 = +2.94% | 128 currently being tested for resistance. Angling down slightly which makes it stronger resistance that if it was flat or angling up.
Volume: Largest volume since August 22nd. If shooting star closes on volume spike then it would be a strong indication of a reversal
FIB’s: 0.382 = $7,417 | 0.5 = $7,119
Candlestick analysis: Daily shooting star is forming. 4 hour candle has nasty bearish wick with large volume.
Ichimoku Cloud: Cloud was breached, but has quickly pulled back. Interested to see if we close below cloud. 12h cloud has been breached.
TD’ Sequential: Monthly recently closed a red 1, now we are on a red 2. Weekly G1. Daily G2 > G1 has reset the setup and was expected due to G9 closing below the 6 and the 7.
Visible Range: Outside the volume area from past month. High volume nodes up to $8,500 with 1 year lookback.
BTC’ Price Spreadsheet: 12 = +0.83% | 24h = +1.18% | 1w = +8.11% | 2w = +15.94% | 1m = -4.66%
Bollinger Bands: Current candle wicked off top band. Mentioned that August 28th felt like July 19th when we last saw two candles close outside top band. Now this current pump feels like July 24th which was a great selling opportunity. Weekly MA is acting as resistance and a quick retest could be exactly what we needed before turning around.
Trendline: After violating trend that connects August 22nd to August 27th it quickly bounced back above it. A close below that trendline will be a strong indication of a reversal.
Daily Trend: Bullish
Fractals: UP = $8,317 | DOWN = $6,805
On Balance Volume: Coming up with price / no div
ADX: +DI getting ready to cross -DI on weekly which doesn’t mean anything until ADX is > 20. ADX & +DI turning up on daily while -DI turns down.
Chaikin Money Flow: Looks like it is starting to turn over on daily. Creating a lower high is important for bears. Want weekly to breakdown -0.08 to indicate being oversold enough to end this bear market.
RSI (30 setting): W = 50.39 | D = 53.69
Stoch: Just recrossed on daily > 80. 3d trending upward nicely with plenty of room to go. Weekly recrossed and is diverging fast.
Summary: Almost everything is going according to plan. The sharp reversal in the btcusdshorts is giving me a cause for concern. I have never seen anything like it before and that makes me feel uncomfortable. Getting another squeeze from here could realistically push us above $8,500 where most everyone turns bullish (first higher high in 9 months).
The main reason I am confident that we have not seen a bottom is due to how many people remain bullish. There is still exuberance and euphoria every time we bounce. I am waiting for the panic and fear that is synonymous with a market bottom. Then I am waiting for everyone to be in disbelief and calling for a dead cat bounce instead of becoming euphoric. That is when I will be buying hand over fist.
For now I will continue to carefully short. ETH continues to show more signs of weakness than BTC. When looking at the 1 hour chart BTC created a higher high 5 hours ago while ETH created a clear lower high. Furthermore ETH’s is not in the same danger of a squeeze based on the ethusdshorts chart.
If entering a short I would stay away from BTC in favor of ETH:USD and ETH:BTC. It is slightly less risky and carries all of the reward (if not more).
50% of my position was entered yesterday and I will be very likely to add if a shooting star closes on daily.
Thanks for reading!
Allow me to Reintroduce Myself...
Learn How to Trade! [part 1]
Learn How to Trade! [part 2]
Wyckoff Distribution
Bitcoin Daily Update (day 186)


Coins mentioned in post: