Bitcoin - Point of inflection ahead of Segwit - Bearish Descending Broadening Wedge Formation. $3k yet?

Bitcoin - Lower high being set?
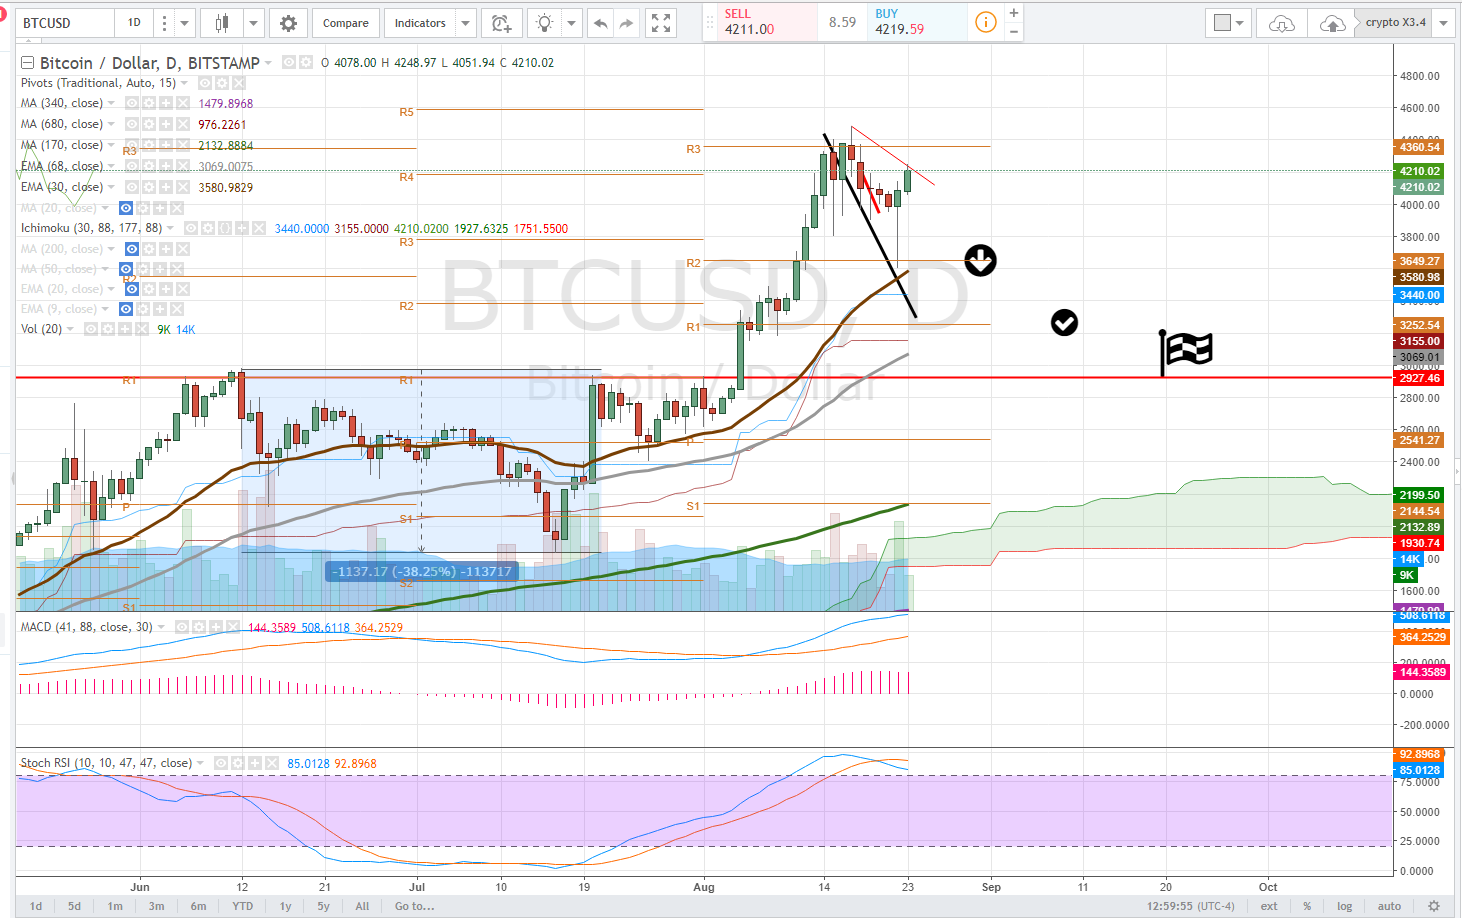
BTCUSD
Daily
Yesterday bitcoin staged one hell of a reversal dropping to our first target of $3600 shedding almost $500 in just a few hours only to stage an epic reversal, rebounding to recover the losses and then some. If you were awake or an astute trader, hats off to you if you nailed that bottom. Yesterdays reversal hammer candle stick has been followed up for bullish confirmation, except that when we look intraday, it may not be as healthy a move as we would hope. A broadening, descending wedge appears to be forming, also known as a descending megaphone just hours ahead of a segwit.
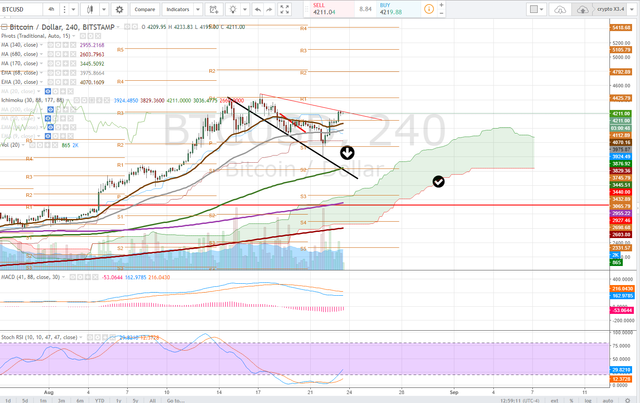
4 hour
Here we are watching whether or not bitcoin can breakout and set a higher high, a print above the previous high $4480 ish would be very condusive price action to stave of any more bear attacks. Not the stochastic RSI is trying to push toward uptrend. We go deeper.
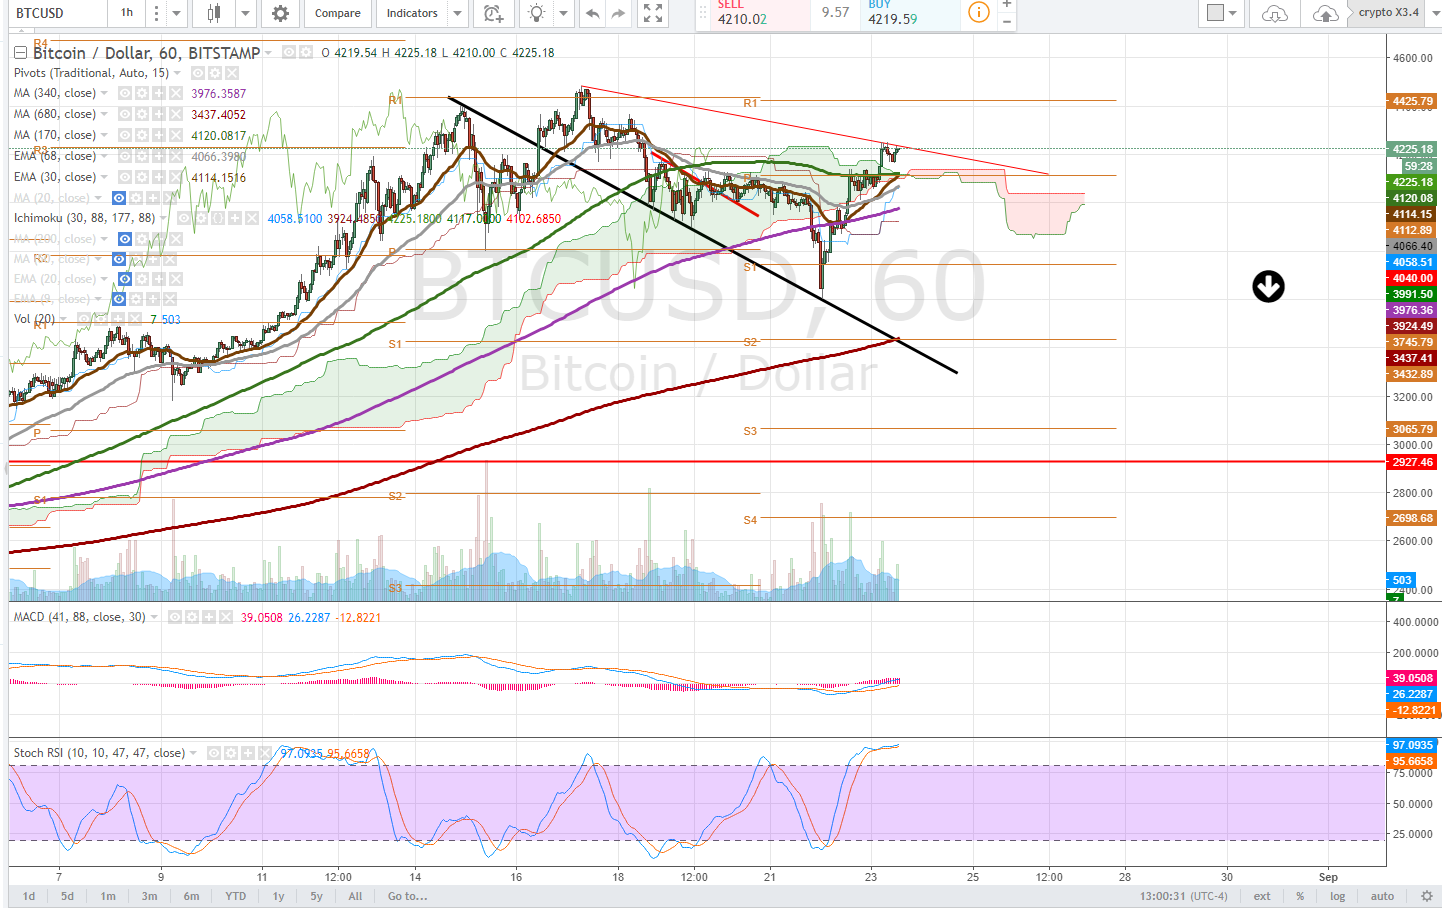
1 hour
On the 1 hour chart we note the extended stochastic RSI which will have to come back down to 80 ish before it can push higher again, if it doesn't roll over and full cycle. Price action has slowed and clearly there is lots of supply in this range as volume is supporting both buying and selling pressure with in the $4200 range.
TRADE: If In a position, set a loose stop loss, if no position wait for direction. If bitcoin turns bearish, scale into alt coins. If bitcoin turns bullish wait for a break above the 1 hour trendline on volume.
ALTERNATIVE: Scale alt coins.
RISK TRADE: Short Bitcoin.
I still maintain my call for a long over due pull back, a retrace to the fibonacci level 61.8% -- or about a 38% decline. The chart is still showing weakness with the failure to print new highs. If bitcoin were to sell here on volume we would have some more trendshift confirmation through the printing of lower highs and lower lows.
I still hold a position in bitcoin and will be using dips as opportunites to trade alt coins and bitcoin buying opportunities
$3808 gave way to $3600, loosing $3600 will give way to $3450's - the ideal retrace is to the $3080-$2929 range. Lets see what happens when we reach the segwit block. Often times in technical analysis we find that an event is priced in or that price action leads the direction ahead of an event
Broadening Wedge
Descending Broadening Wedge Identification Guidelines
Previous Articles:
Trading Vs. Investing
Bitcoin
Weekly Overview
ETHUSD
bullish setups
Follow at your own risk, Not a financial adviser, understand the risks associated with trading and investing. Manage your own Risk - in other words you could lose it all and I could give a fuck.

Stats about BTC only?
all technical analysis in this post is done on BTCUSD
Nice TA on bitcoin chart.
Thanks for sharing your knowledge!
quite welcome, its a bit of a binary trade, but i still lean bearish from all of my other charting, though i'm not short, merely an opportunity to accumulate more if it presents itself via trading alt coins or BTD
You Are An Excellent Steemian. This post has received a 25.00 % upvote from @steemthat Return the favor and SteemThat Person Back: @binkley. .
.
Using @steemthat Is Easy. Just Transfer 0.010 to @steemthat and The Steemit Link You Want Upvoted In The Memo.