Is the Correction Running Out of Steam?
The bull run seen in the last Quarter of 2017 took us for a wild ride. It is rare to see price movements of that magnitude and because cryptocurrencies are new assets many of us who have just begun our trading careers may have gotten a little discombobulated by the volatility of BTC i.e. (it is a new asset so maybe it will continue past 20k and not correct at least 50% like we have learned through all of our studies). The correction was imminent of course. If we do not want to suffer drawbacks then we must take BTC profits and convert into cash to tide us over on our way to the moon. One mistake many of us made was to buy back in too soon and/or too much. We may have a long-term bullish sentiment but do we have enough capital to survive the drawdowns?
Well, I don't know about you guys but this bear season needs to be over. I'm looking at this from the glass half full perspective.
Here's a screenshot of the BTC daily chart. As we can see the price appears to be testing the first bottom seen on Feb 6th in the 6k-7k range. This would give us a double bottom which is one bullish signal. View the green ellipses. The first ellipse marks mid November 2017 when prices smashed past 7k to 10k where it was briefly tested all the way to 18k where it was again tested and trying for 20k where it is at the very least a psychological price ceiling.

I also spot a triangle or a wedge. From what I know about triangles they are usually signs of continuation, which would not be a good sign for those that are long BTC as this would usually indicate the price will continue its falling trend. Wedges in the other hand are indicative of reversals. So we could look at this as a wedge but you can probably see how it could also be a descending triangle. If it is a wedge this is a bullish sign.
Prices are still below the 50 and 200 day moving averages. The 50-day MA has just crossed below the 200 day which is not helping my bullish outlook. 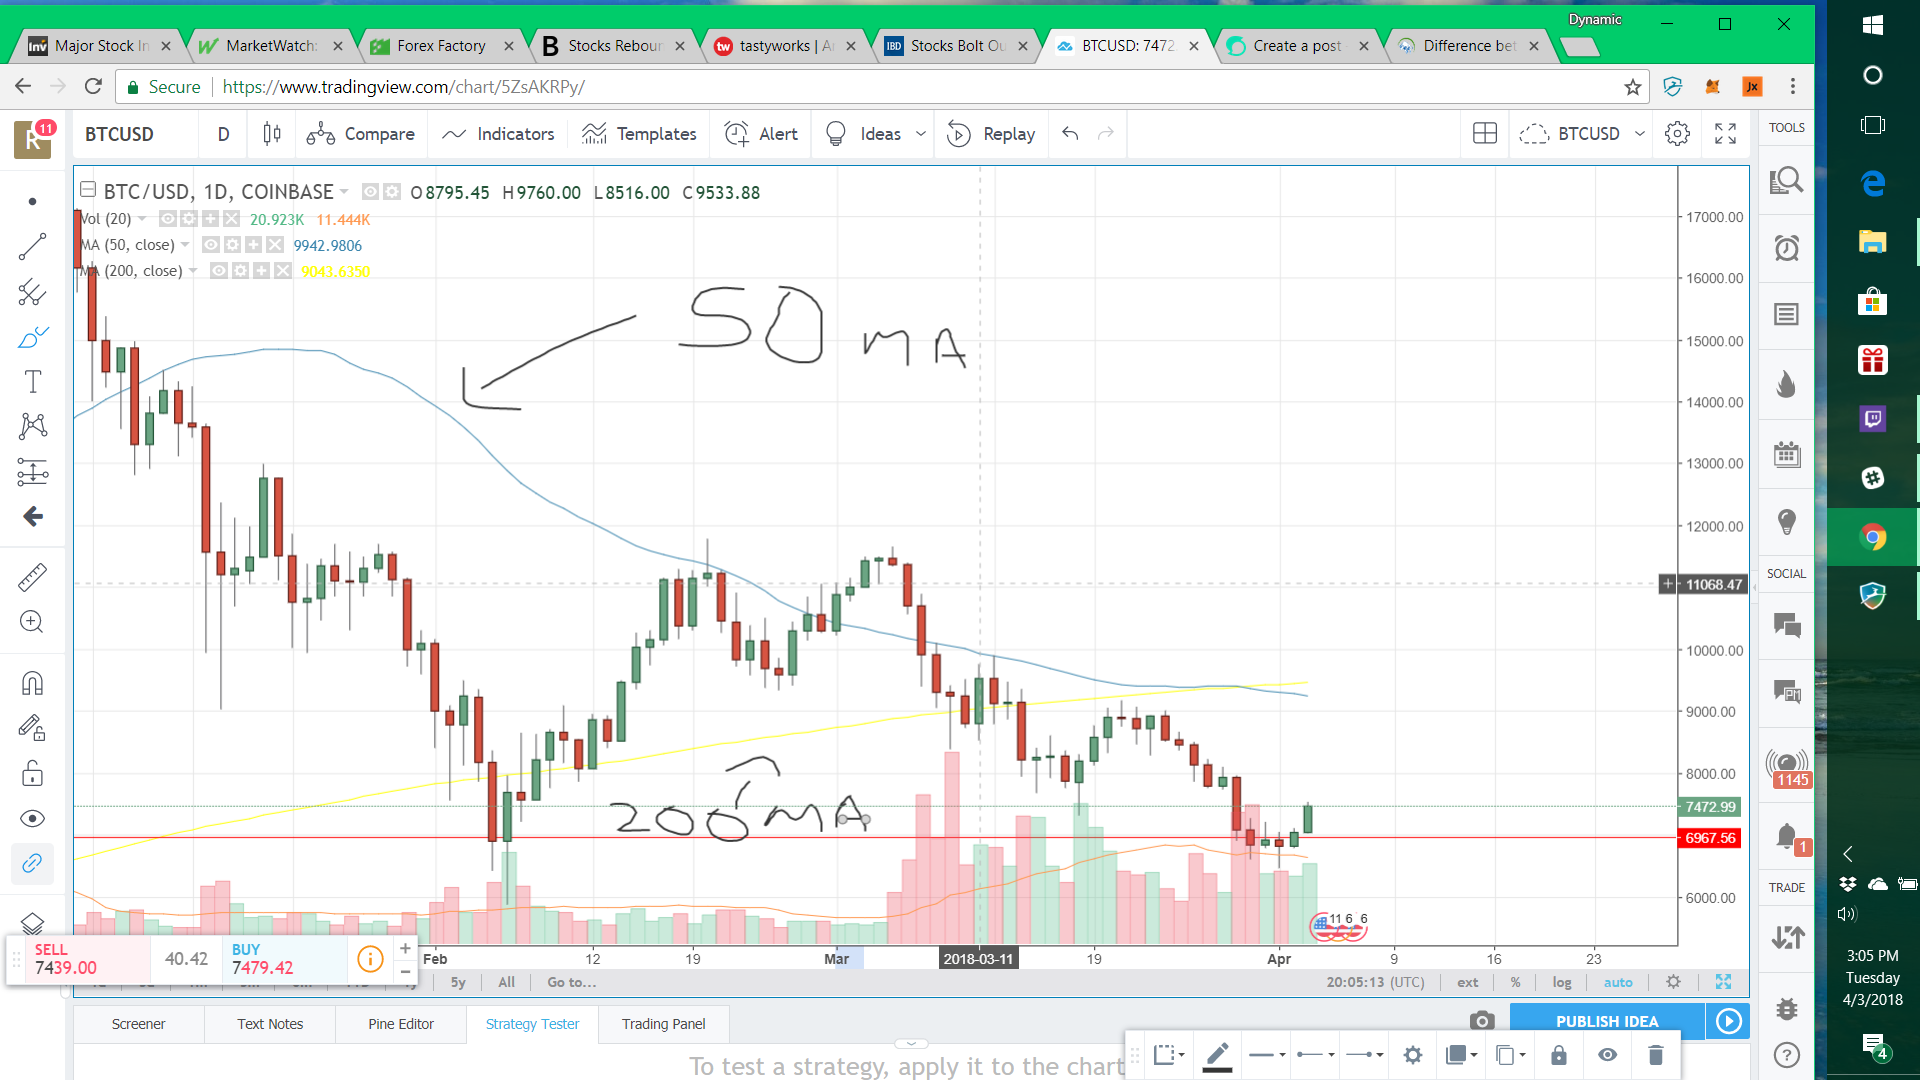
Here are some of our lagging indicators. (MACD, RSI, Stochastics) They are struggling to give us bullish signals. All the signals preceding have been fakouts thus far.
So my conclusion is that 7k is a new bottom. 10k and 12k will play small resistance. The real bull run won't start until 10k support is established and tax season is over. So I don't know about you guys but that is where I'm at with all this.
To the question in your title, my Magic 8-Ball says:
Hi! I'm a bot, and this answer was posted automatically. Check this post out for more information.
Yeah, whatever!