12/2/2017 The Market View and Trading Outlook
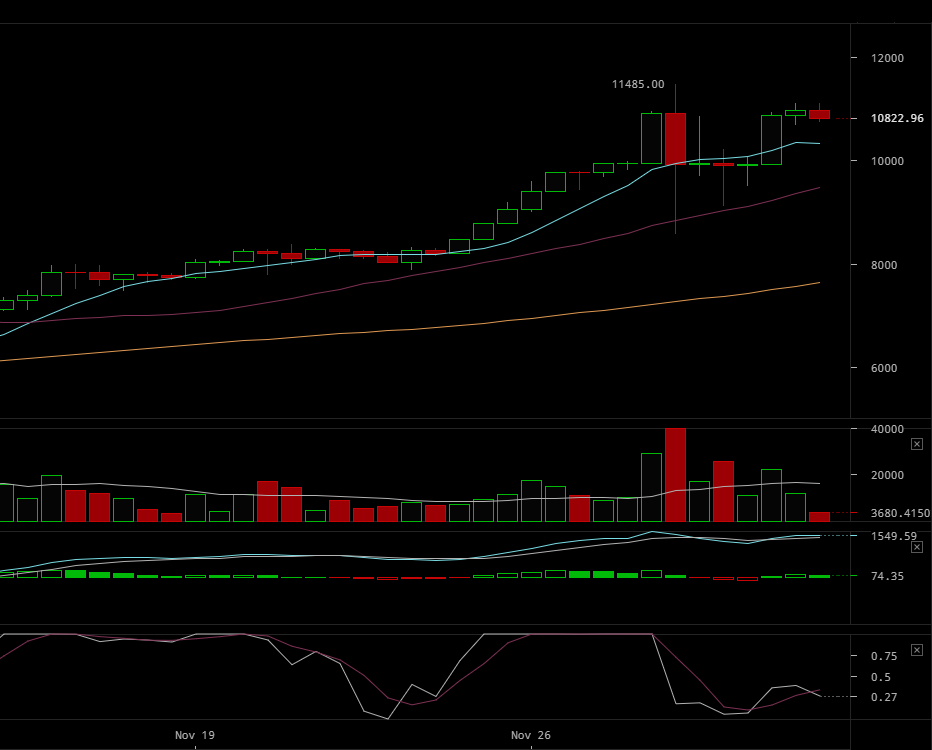
As stated yesterday, Bitcoin trended up where it met strong resistance. It was an epic Bulls vs Bears Battle with BTC trading on low volume in the narrow $10,500-$10,600 range most of the day. This could have been accumulation and support building in order to make an attempted break out which it did and failed.
BitCoin made a somewhat normal test of the $10,900 area, wherein the FOMO crowd jumped in and pushed it into the $11,100 zone before fear and lack of demand pushed it back down to $10,700, to once more retest and fail the $11,100.
.png)
At current we are sitting at $10,900 with the hourly MACD looking somewhat grim. The two, four, and six hour time frames essentially tell the same story. That being that yesterday was likely a bull trap and the true and healthy correction needed for sustained growth has yet to occur. I am beginning to take the opinion that the initial 20 percent decline from $11,400 to $8,400 was a window into the soul of this market.
It showed how unstable the market is at the moment and just how full of greed, fear, and unsophisticated investors the waters really are. How quickly those without an understanding of market dynamics and fundamentals can panic sell and erase not only their own capital, but the capital of others by helping to initiate a stampede.
Why do these massive selloffs happen and rapidly drive price down? It’s rather simple, really. You have big money (institutions, whales etc.) that were in at the right time making the decision to cash in a portion of their investment and lock in profits. This temporarily, but sharply pushes the price down. Consequently those that are riding on the edge of their seats as a result of being late to the trade in the hopes of a quick profit see their investment turn negative and mash the sell button to avoid further losses. This starts a chain reaction that crashes the price.
This entire scenario is of course predicated on the Order book (supply vs. demand) being able to absorb the initial big money sell off that started the process. At one point prior to drop on 11/28, the order book showed 4000 BTC ($40,000,000) to raise the price by 5% and 400 BTC ($4,000,000) to drop the price by 5%. That is not a healthy balance; it is a clear indication of fear, uncertainty and lack of faith surrounding the price at that point. This many sell orders, so close to the price, combined with so few buy orders tells me there are a great many looking to sell close to the money and make a quick buck with hopes that the price will go down again so they can buy back in. Investing in an asset you want the price to go down on?

Ok, enough of the lecture and onto the trading outlook of the day. I see two possible scenarios playing out. The first being that we are in a bit of a temporary Bull Trap, a vortex of hope looking to suck in the small money and then wrench it from their fists in an upcoming correction. To that end; Bitcoin attempted a break out yesterday, was unable to find the previous high and met strong resistance at the $11,100 level; twice failing to break it.
We could see a day of sideways trading today, followed by more days of sideways trading, attempted and failed breakouts ending in a marked sell off toward the $7000 dollar range at some point in the next week or so. As basis for that theory I look at the 12 hour, 1 day and 3 day charts. All except the 12 hour show that Bitcoin is at the moment very overbought; there are a lot of HODLERS. Most likely those looking to make a quick buck, FOMO’s waiting for that $11,400 to go green again and big money that bought heavy in the $9000 range; all of which are waiting for the right point to SELL.
The second and I think less likely scenario is that we are base building in a period of consolidation for more upwards price action, I'm not talking retracement, but new highs prior to entering a more normal corrective phase. Thus making it even more severe as more will be pulled in. Lets look at the breakdown of the charts and you can decide.
There is some contradiction in the 12 hour as it does not show BTC to be overbought, it does show the StochRSI trending down, decreasing volume, upside price divergence, a cooling 12 hour period and we are well above and likely to far away from the moving average of $7600; all indicative of a sell scenario. As BTC tends to defy logic I would not be surprised if we tried and failed to rally again before falling.
.png)
The one day chart, and for me this is where the story gains much clarity. Firstly there has been no correction, just a day of panic selling influenced by a lack of faith in price levels at that point. If we look at the drop for $8000 to $5500 that was a correction; it was short but it counted. There was a heavy day of selling a few days prior to that correction, an attempted and failed rally following it and then it began. While it only lasted a week or so, during that week everything for a time at least came into balance. The price came back to the trend line, the divergence in the MACD disappeared as it crossed over and the StochRSI put us back into a position of oversold. All being conditions that add fuel for future price growth and none of which happened in the most recent dip. At current the chart says we are Overbought, have price divergence to the upside, decreasing volume, and a cooling period of buying. Even the attempted rally of yesterday fell way short of the sell volume of the prior day. Again this is all indicative of a sell scenario.
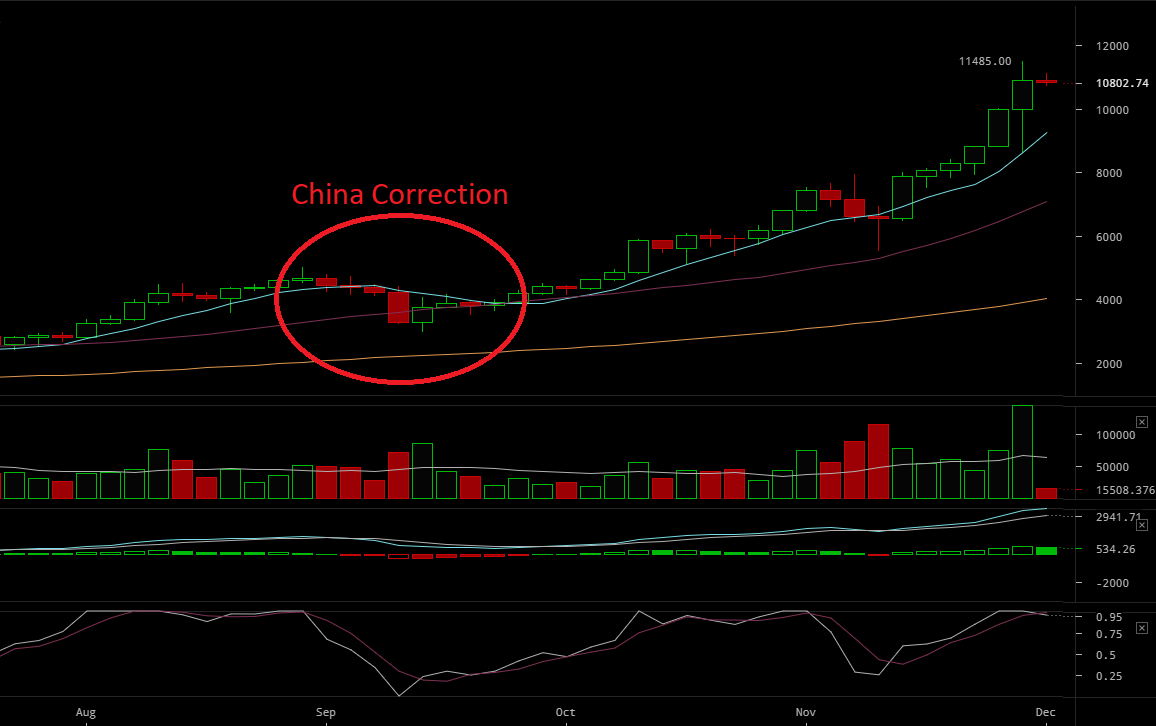
If we look at the 3 day chart we see the same story, overbought, upside divergence, way extended from the moving average etc. The volume can be deceiving; however if I adopt a contrarian point of view I can see that it was drying up prior to the run from $8800 to $11,400; a run that I think was largely influenced by press and hype fueled greed. If I use that chart as my basis to make a prediction; the last true correction occurred in the $5000 to $3000 China panic drop. Whereby it fell to a predictable corrected price point based upon Fibonacci retracement starting at its beginning in the $1800 dollar price range. Applying the same Fibonacci retracement to the current run of the same period we end up around $7200.00. Again all indicative of a sell scenario.
So what does it all mean? Most likely we are going to have a period of sideways trading, during which and depending upon how long it lasts the moving averages will slowly creep closer to the current price point to act as future support when the actual correction occurs. As Bitcoin prices do defy logic and its price is fueled solely on greed and not fundamentals, I would not be surprised to see another short term run up or a series of them. That said and with 100 percent certainty the price will be coming down here at some point. Since the conception of Bitcoin the 1 day and 3 day charts have yet to tell a lie and will always drag it down at some point to consolidate prior to another big run. I would play it carefully, trade the trends on the two and four hour time frames (if you get in within two periods) and keep a very close eye on the six and twelve as when they go red things change quickly from good to bad.
Today expect sideways trading, a likely failed rally, consolidation by big money on the dips looking to dump it in your lap when we do actually enter the corrective phase.
Etherium @ $457
Ether has remained steady, bouncing around a bit yesterday but not really making a huge move one way or the other. At current we are still sitting at $457.00 with the 4 hour time frame predicting an upcoming downward move sometime this evening. I would look for strong support in the $400 range as it has tested and held twice at this point. If BTC goes sideways, trend trade with buys in the $450 and sells in the $460 area. Be careful on this one as it failed to gather any momentum on the failed BTC rallies of yesterday and seems overbought and prime for drop.
Litecoin @ $100
I’m not saying overpriced, but I’m not saying it’s a value buy either. I watched the charts like a hawk yesterday and someone was accumulating 1000 piece lots of LTC within seconds of each other on 3 exchanges. This likely explains the run up to near new highs while Bitcoin was trying and failing to rally. While it is overbought, there is little in the way of divergence to the upside and the charts actually tell me we may get a few dollars positive price performance before diving on the four and six hour time frames to the low 90’s (this dependent on the overall health of the market). I would set some real out of the money buys in the high to mid 70’s to catch an actual correction on BTC, maybe even a few in the $60’s and high $50’s if Bitcoin uses the next week or so to test lower support levels. Think of it as a catch net with your reserve capital. Look for short term daily buys in the $93-$95 zone for quick sells for anything above that. If you wanna play real risky play .50 cent moves in the upper 90's and be prepared to get out. At current price I would stay away as it seems more primed to drop than pop up. Expect it to trade in a very, very narrow range today hovering around the $100 mark as the market waits for BTC to make a move.
That said demand seems to be a bit lacking

I missed the run up on Litecoin yesterday from $93 to $100, but it was just as likely to go the other way. I lost nothing and don’t like to enter trades where I have to sit poised to sell for fear of getting capital raped if it goes the other way. That said having a discipline and sticking to your trading strategy will force you to miss some opportunities, but more often than not it will also save you from getting hurt. Opportunities to gain % points in the trading arena are a daily occurrence; so I really missed nothing.

That "window into the soul of this market" might be just a teaser. Lots of people have been talking about, and many actively sharing trading strategies on, parabolic moves. The abyss could be a lot deeper than anyone thinks, with a negative feedback loop dwarfing the positive that has led us up. Think of the massive inflation in USDT. According to this reddit post, more than 9600%!
https://www.reddit.com/r/btc/comments/7g4mjj/tether_the_cryptocurrency_backed_by_nothing_with/?st=jaqpe1hy&sh=991531be
How does that affect Bitcoin's price? I dare say that there's a fairly direct relationship given that most of that Tether is backed by Bitcoin. It reminds me of a kiting scheme. They feed on each other.
https://coinmarketcap.com/currencies/tether/
http://omniexplorer.info/lookupadd.aspx?address=3MbYQMMmSkC3AgWkj9FMo5LsPTW1zBTwXL
Tether may be the greatest PONZI scheme to ever exist. That is a scary situation indeed. Moreover the lack of transparency from Bitfinex is scary as hell. Of the little information that has been garnered or spoken by the company, CEO, owners etc. it is full of inconsistent facts. We don't own tether, we do own tether, we do have a bank, we don't have a bank, we lost our funding but company value went up, no one can convert tether, you can get dollars from it, etc.. That is one big mess.
That exchange is just rife with corruption. I like the following articles to be taken with a grain of salt in regards to Bitfinex using wash trading to increase volume and there by valuation.
https://medium.com/@bitfinexed/wash-trading-bitcoin-how-bitfinex-benefits-from-fraudulent-trading-8bd66be73215
https://steemit.com/bitcoin/@pawsdog/12-2-2017-the-market-view-and-trading-outlook
I saw a lot of wash trading last night on GDAX, 1000's of .50 cent buy and sell orders within seconds of each other that continued for hours, might still be going on.. have yet to check the charts.. sorry if my writing is off just starting my first cup of coffee....
I just published a post on Tether and BTC: https://steemit.com/trading/@cryptographic/a-disaster-in-the-making
If you don't mind, I'll link your above comment in the comments section of that post . . . when a relevant opportunity arises . . . that is unless you don't repost it yourself first. 😉
Provided you a detailed comment, resteemed and upvoted... :).. You the man.. love your stuff.. I'll keep some rations in the bunker for you when the shit hits the fan.. :) I'll start adding you into my main content to avoid you getting shit canned in the comment shuffle..
Just read it. Much appreciated. It's great to have you around. STEEM's success depends on quality content, and yours is definitely that! Cheers.
Throw a brother a resteem on this one:
https://steemit.com/bitcoin/@pawsdog/12-3-2017-the-market-view-and-trading-outlook
Some nice comments would be cool too.. that is this mornings work...
That was my guess as well.
I just have a gut feeling about it. Which is a horrible way to invest.
Great minds, think alike.. can a I get a resteem on this. I will return in kind
Seeing the same setup on the LITECOIN order book
Another rally attempt building at $11,000?? could be. Seems as though it may be trying, but I think it will be more firecracker than fireworks...The tension is building...
@originalworks