How can waves tell us the Price ?
For someone who just heard about the waves think it won't work, the price of a coin depends upon the market and the market is almost unpredictable. There can come a news and the price of a coin may jump or dump. It can never be predicted with waves.
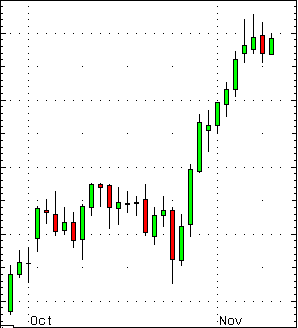
For you to understand how it works first you need to learn how candle sticks work. The above picture shows a candle stick chart. The green one shows the price is moving up and the red one shows the price is going down. The line in the middle of the candle stick shows how less or how high it has gone in the last 30 minutes (considering a candle is of 30 minute). The moving candle sticks makes a pattern and some kind of wave.
How can price be predicted ?
Some websites like coinigy provides you the platform to study those candle sticks. You can draw lines, change the times of candle sticks, write something there and as a whole make some results. When you work on that and observe various patterns you can know how the market is working.
I will explain about some of the pattern :
Cup and Handle Pattern
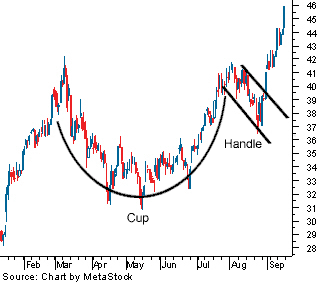
Look at his chart (Source : Investopedia). It forms cup and handle pattern which will result in some massive increase in price. This pattern is bullish in cryptocurrency.
The ultimate question by a newbie is WHY?
Try to understand the pattern, people are buying and selling. The number of buyers are more than the number of sellers. At point it becomes constant for a very little while and most of the buyers want to take their profit out, making the price go down. The price goes down to such a extent that the number of seller and buyers become stable. It remains stable for a long time. When the number of buyers increase a little bit then the coin get into focus and the number of buyers rapidly increase. Those who bought the coins during rather stable state wants to take their profit out creating a small handle for the cup. After that the number of seller will diminish and buyers will be bullish creating a bullish upward trend.
So, Mr Eliot didn't just made those charts coincidentally he observed the similarity between all the markets that grew and came to a conclusion with possible reason. There are explanation for all of the waves and it is good to believe in those waves although they are not 100% accurate.
Thank You for reading and please help me to fight against those bots which are not letting steemians have healthy competition with each other.
Here is the link of my another post explaining everything:
https://steemit.com/steemit/@pathi/the-rival-of-steemit