You are viewing a single comment's thread from:
RE: Bitcoin (BTC) Mid-Day Update: Price Sitting on Top Trend Line as Support
Hi there.
What you posted caught my eye, because I have recently been studying trend lines through various resources.
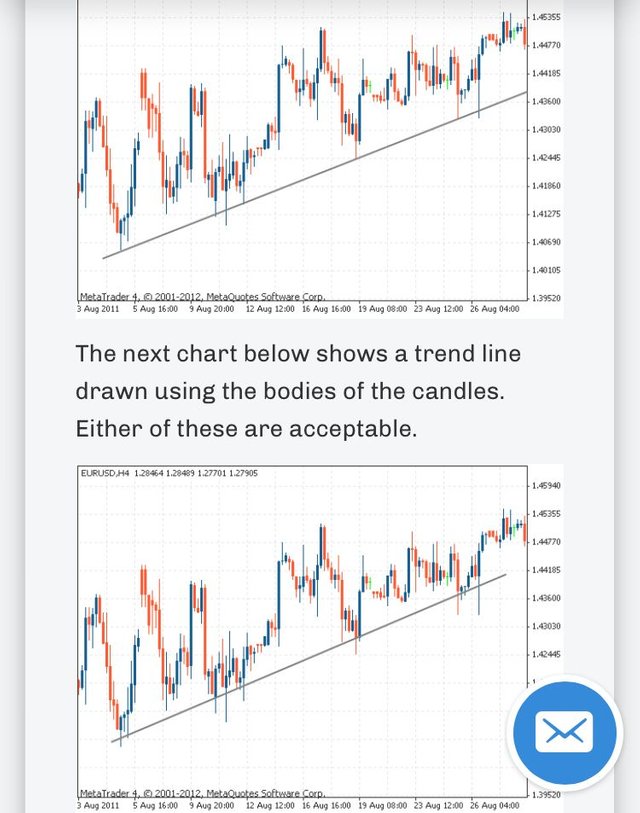
In one such resource, which I have attached an image of below, it is said that trend lines can be drawn from the wicks or the bodies of the candles. While Haejin's line is off from the wick by a hair, it could still be drawn upon that wick, I think. Also, once a trend line is drawn, the importance of sticking with that is emphasized, which I believe is what Haejin is trying to do.
I have also seen other analysts come up with the same chart as Haejin, except they are not being put down about it, such as https://steemit.com/cryptocurrency/@scaredycatguide/bitcoin-breaks-out-of-the-descending-channel .
OK, but the support line based on the wicks is lower than the support line based on the closes. So you will get in your sell position at a lower price if you are waiting on price closing below the support line which is based on the wicks. Do you want to get in at the optimal sell price or a less optimal sell price?