BITCOIN Seasonal Average cycle 7 years ... A look to 06/11/2017

BITCOIN Seasonal Average cycle 7 years ...A look to 06/11/2017
I have reviewed the BITCOIN seasonal chart and I share it with everyone who cares
Whenever I have the opportunity to collect data on financial assets, I like to put them in excel and look at their seasonality*
Introduction about Seasonal Charts
What is seasonality?
Seasonality is a seasonal fluctuation or cycle forming a trend or pattern. The best-known seasonal pattern is that of the outdoor temperature. Markets also demonstrate seasonal tendencies or trends i.e., the year-end rally in the stock market or low heating oil prices during the summer. There are a number of various reasons for these seasonal patterns, for example: the weather itself, harvest periods, the heating season, interest payments (i.e. at year end), investor sentiment during certain times of the year (i.e. in autumn), yearly or quarterly financial reporting of companies or investment funds.
What are seasonal charts?
Seasonal charts show the average trend of the past several years. The time axis is scaled in months, the vertical axis shows the relative value change compared with 100. The end-value of each chart shows the average trend development over the corresponding years.
Attention, Very important : These data do not represent exact movements, we only look for an orientation on the average of the movement ....
![bitcoin-01.jpg]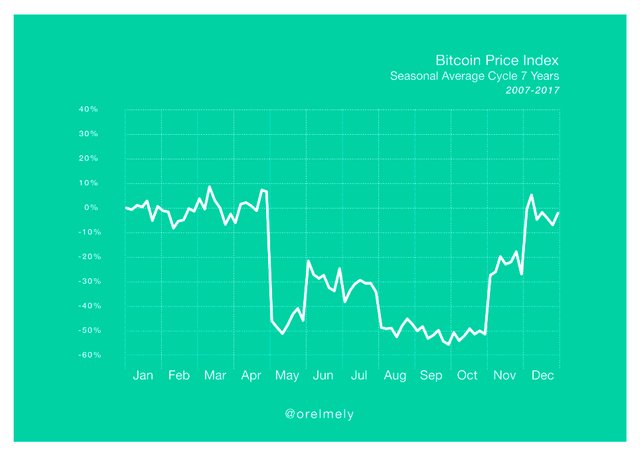


Raw data source: https://www.quandl.com/
Disclaimer:The information here does not represent any recommendation ....
The percentage of the values can vary +/- 2% on those provided by quandl.com
Feel free to use these graphics for your benefit .. be happy

Please, can you clarify, I am not a native english speaker. is the x-axis for days of the month or for year. And the y-axis are for daily growth or monthly growth in each case. Thank you, so much.
Es un grafico estacionario....
Marca el promedio
El eje x es un % simplemente...
Feel free to use these graphics for your benefit .. be happy
@maarnio
@ghasemkiani
Thanksss !!!
This post has received a 2.78 % upvote from @buildawhale thanks to: @orelmely. Send at least 1 SBD to @buildawhale with a post link in the memo field for a portion of the next vote.
To support our daily curation initiative, please vote on my owner, @themarkymark, as a Steem Witness
@jkrandroidtips
@kramarenko
Thankss !!!
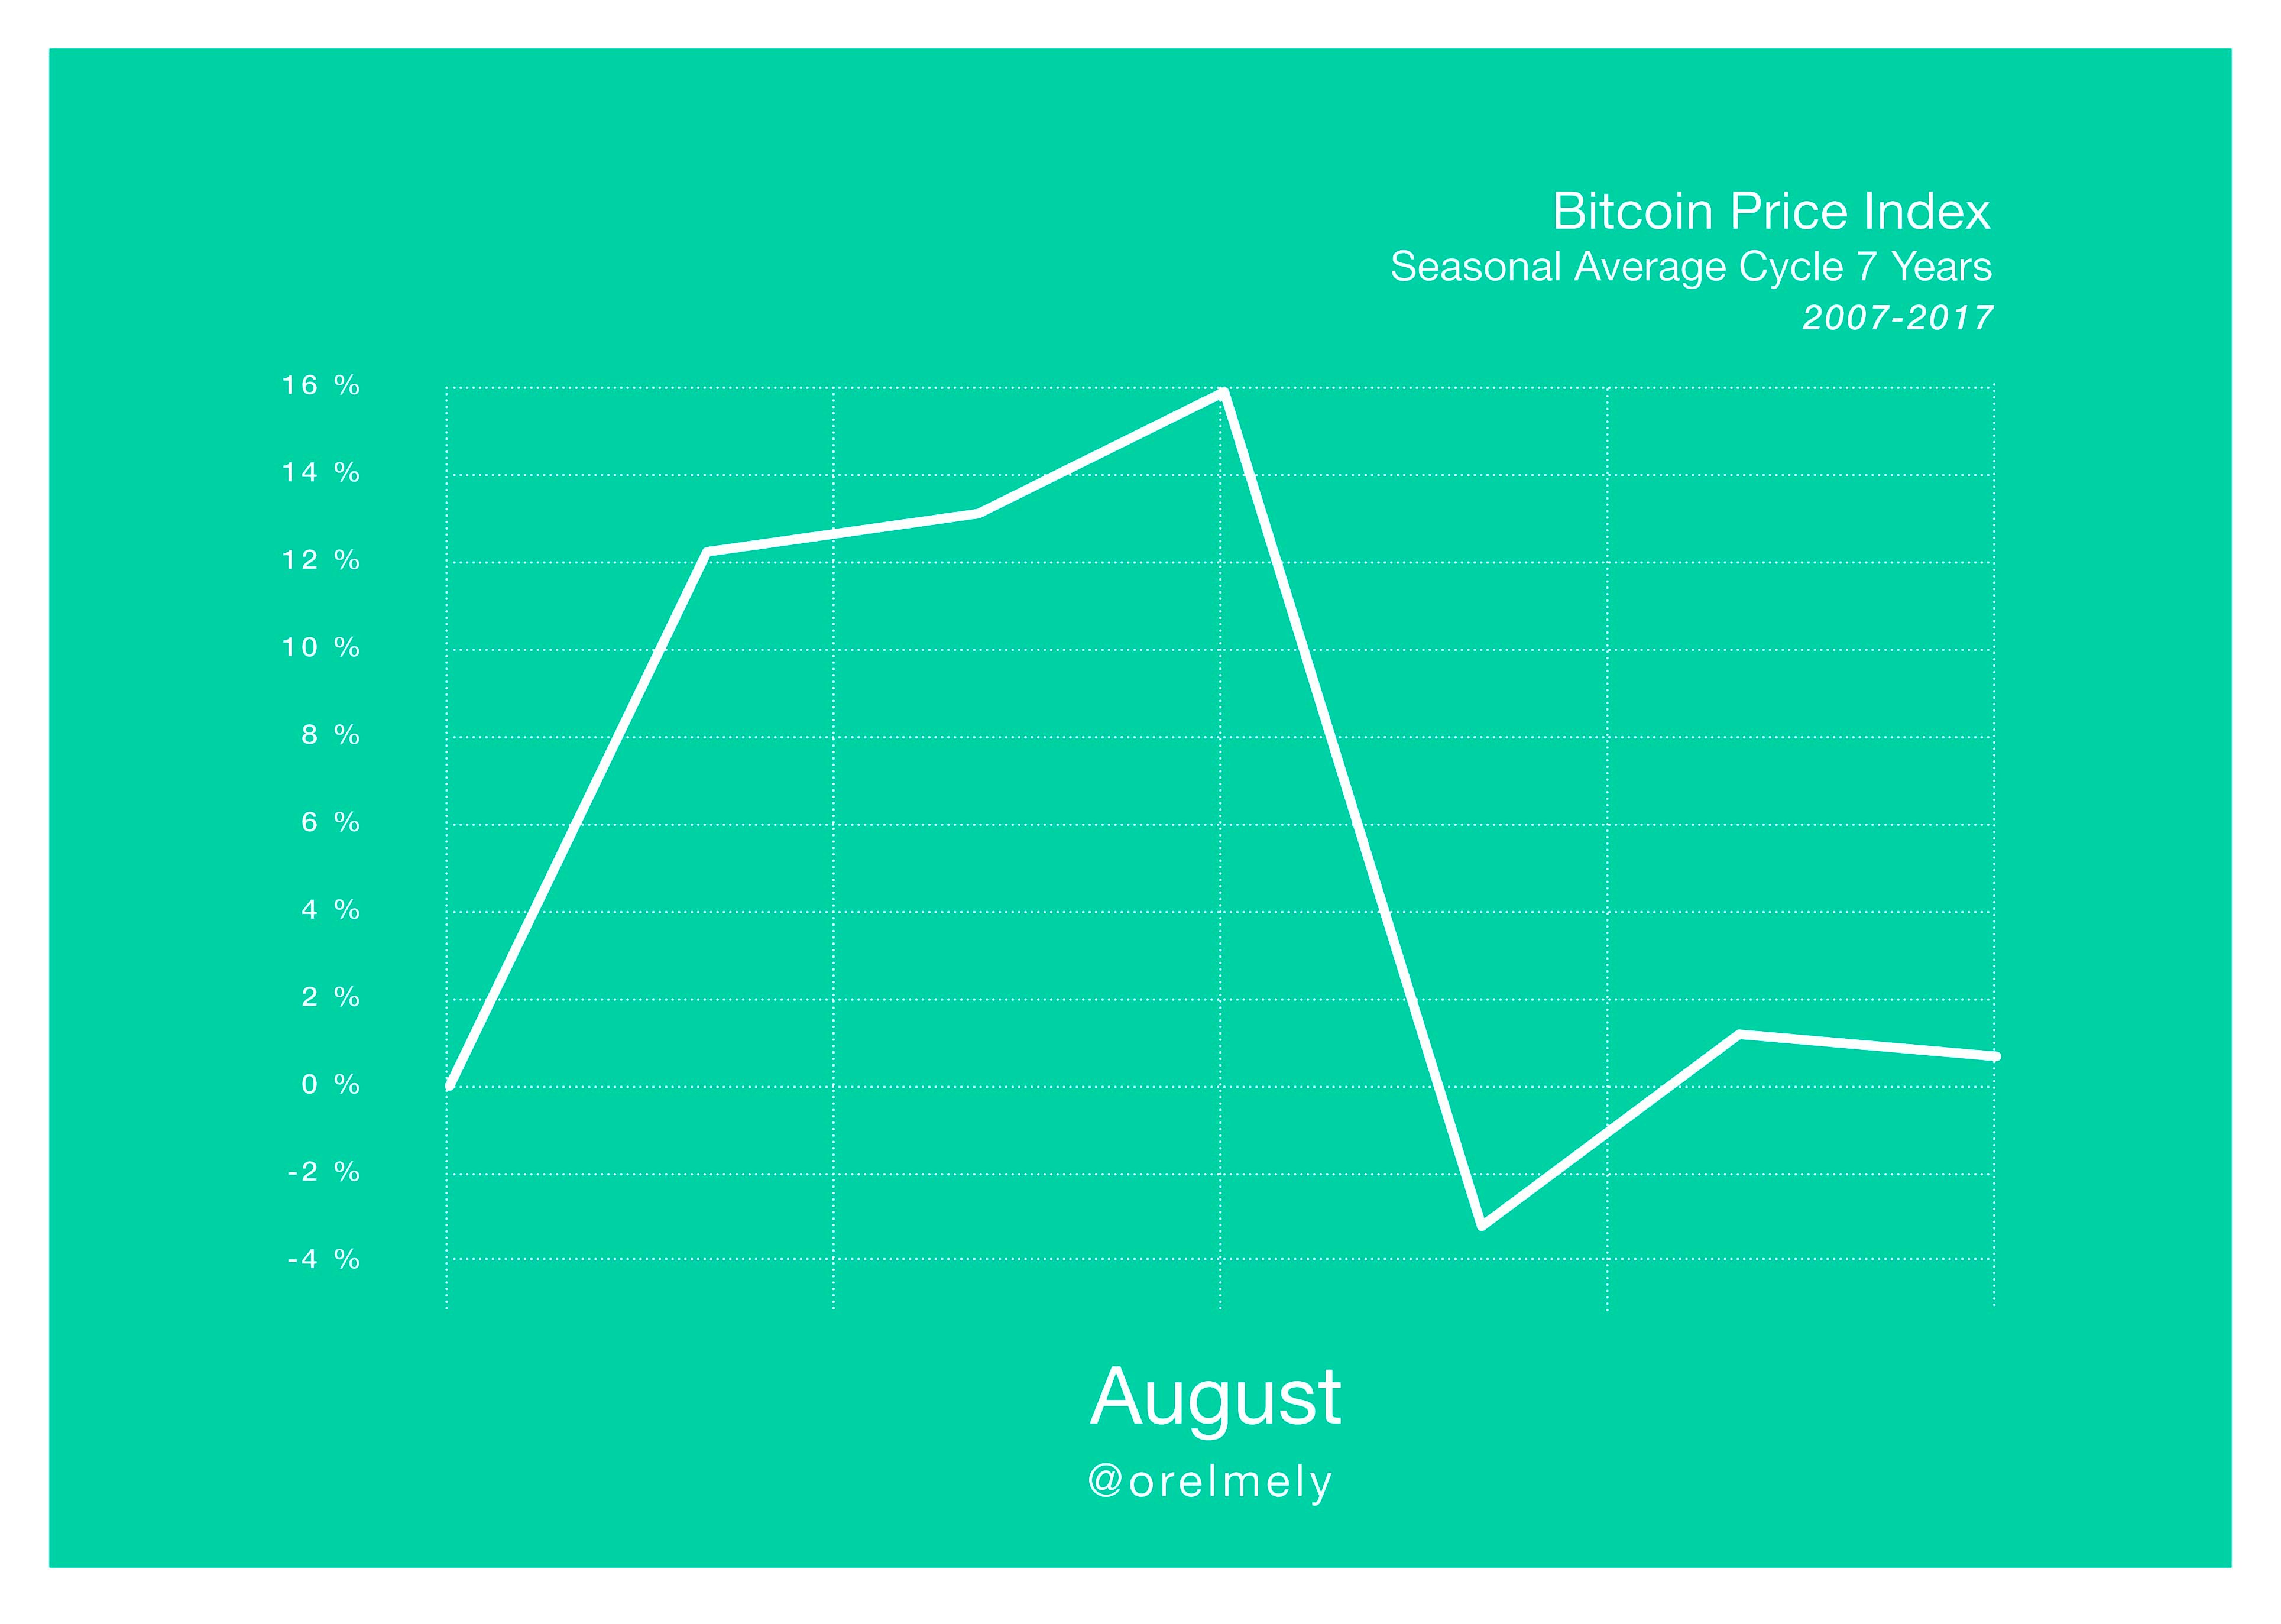
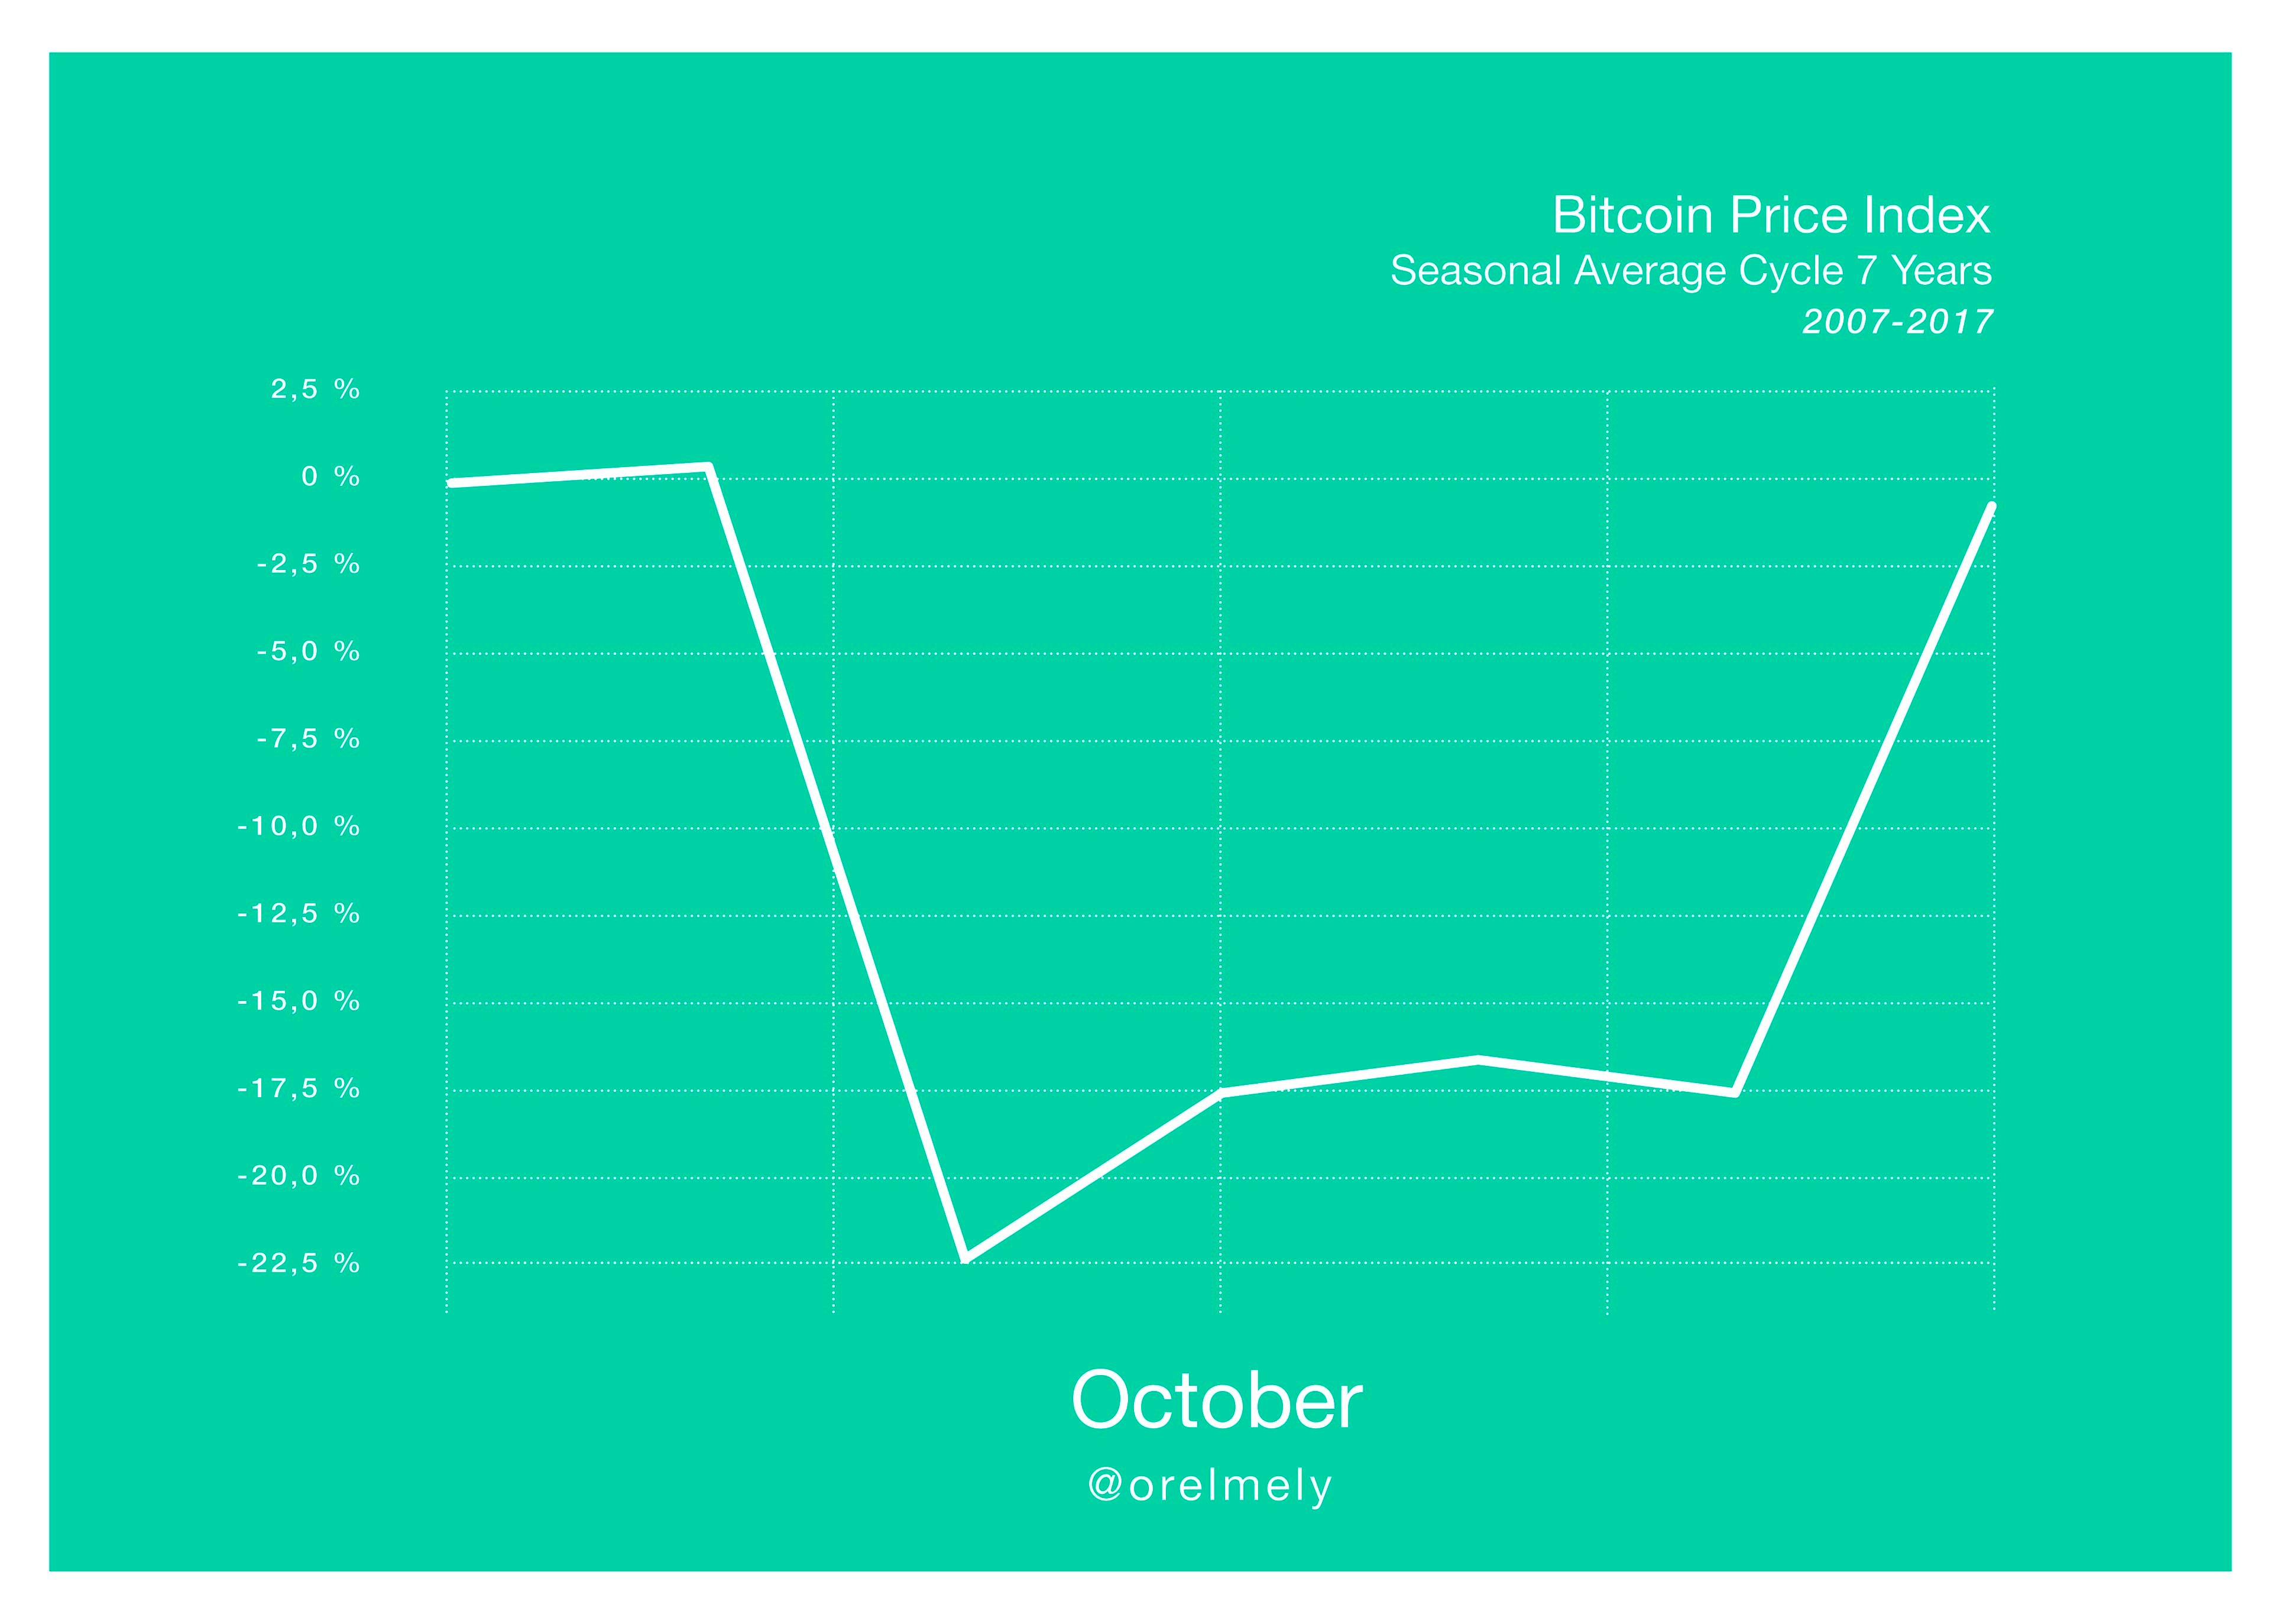
If you are interested in this type of seasonal charts about an asset, write it in the comments and we will try do it...