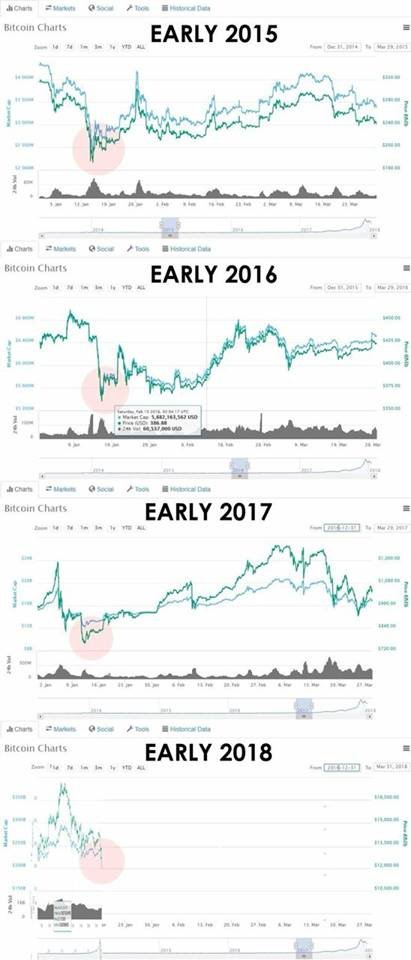
We are at the bottom of a market cycle. Every January for the past three years we have seen the market take a hit. The lows were found on January 12, 2017, January 16, 2016, and January 14, 2015. It would appear that, if this recent drop is the absolute low or near the soon-to-be low, then we are right on track and should see a renewed bullish trend pretty soon. This would also fit into the other narrative I have mentioned which is that Bitcoin market corrections generally take 5-7 weeks to complete, and we are now in the 5th week. We should generally expect to see the $17,000 level in about 7-10 days, if things continue following the same patterns, and $20,000 within a week after that. Is this going to happen? There are no absolutes or guarantees in the financial markets, so we don't know for sure. Things have continued to line up as we have mentioned, which is a good sign, but we must remain vigilant in watching the charts. Interesting to note is that the low just hit was within $35 of the low hit on December 22, 2017, which is at the 50% "Dow" retracement level as measured from the September 15, 2017 low of $2972.01. As I have mentioned before, usual Bitcoin corrections are between 50%-61.8% retracements. As a matter of fact, the correction on September 15, 2017 hit the 61.8% level. Because this low matches the low found less than a month ago, I believe there's a decent chance we could see Bitcoin drop even lower, at least to that 61.8% level which would put it around $9349.11. However, the one final indicator that we need to watch is the 200 day EMA (red line that the red arrow is pointing at). That is a major support level, so if price were to drop to the 61.8% level, it is likely that price might continue to drop until it bounces off that indicator. Currently, that would have price hitting a low of around $8450.
