GNO/ BTC nice 1d chart - Price Action Analisys and BUYING Strategy explained

GNO/BTC is very attractive on daily time frame. It seems getting ready for a parabolic acceleration with potential impressiv gaining!
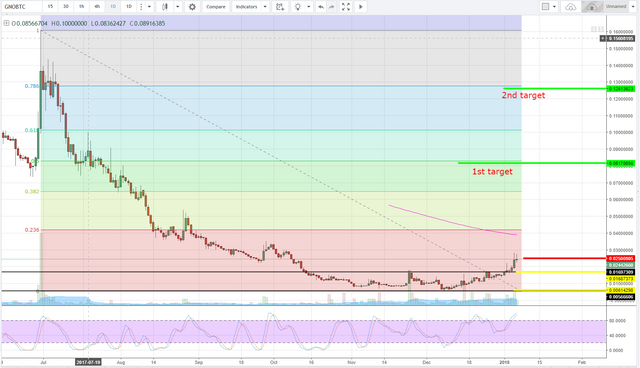
STRATEGY
BUY @ 0.02500805 btc (red line)
If the price goes down: double your first investment @ 0.01687373 btc (first yellow line - important price structure)
If the price keeping going down: double your second investment @ 0.00614298 btc (second yellow line - important support)
1st TARGET PRICE: +225% @ 0.08170856 btc (just below the 50% Fibonacci extension- first green line)
2nd TARGET PRICE: +410% @ 0.12613623 btc (just below the 78.6% Fibonacci extension- second green line)
We thinking along same lines, but can you do your posts in USD or another fiat, very hard to read prices in BTC?
Check out our writeup, since you're into Gnosis...
If you are interested in a short to medium speculative trade in Gnosis in early 2018, check this out...
https://steemit.com/cryptocurrency/@harpooninvestor/gnosis-a-near-term-and-medium-term-call-to-buy
Great Chart and Analysis. You are right on target on this one !
Would you be able to do a chart on FUEL also, Thx !
I will take a look @ FUEL thnx 😊
Just make a short Technical Analysis of FUEL / BTC 1h chart. You can fin it here:
https://steemit.com/bitcoin/@milionarioo/fuel-btc-1h-chart-technical-analysis-of-the-current-situation