Bitcoin Current Situation From Technical Point Of View(Bearish Signs)
Hello traders. SO today we gonna analyze Bitcoin technically discussing its next move. Discussing each sign in detail. Note that we will discuss it in 1Day timeframe. So move will be according to that. Not short term. ok?
Lets get started with the chart.
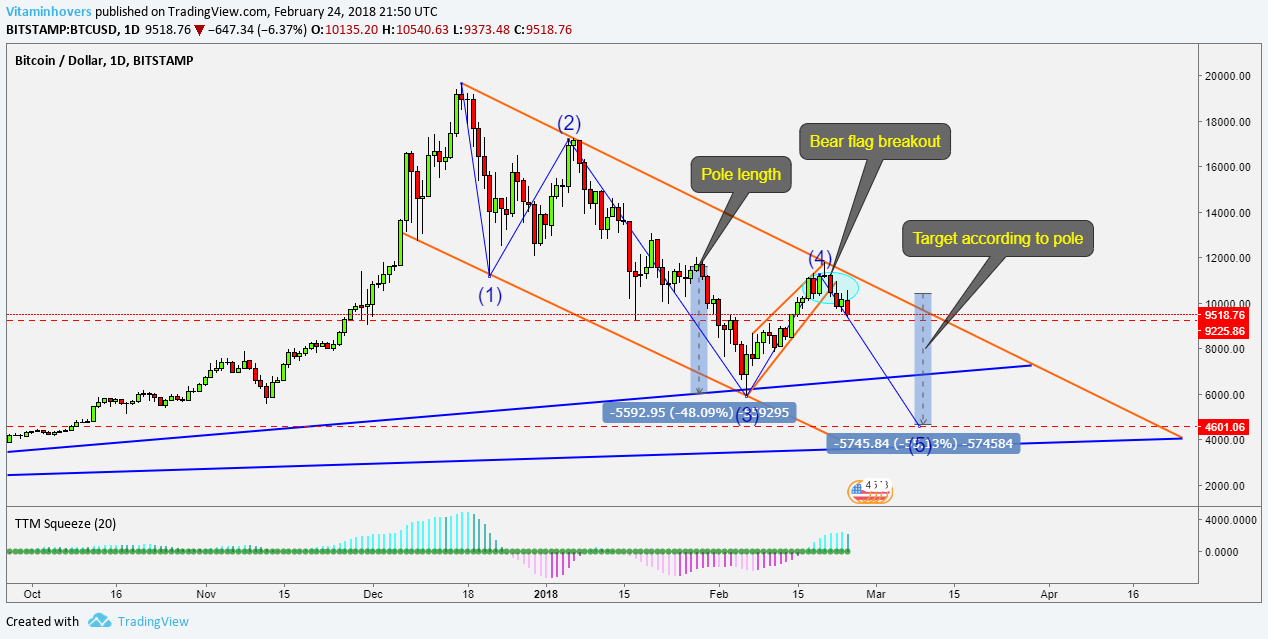.png)
Current Trend:
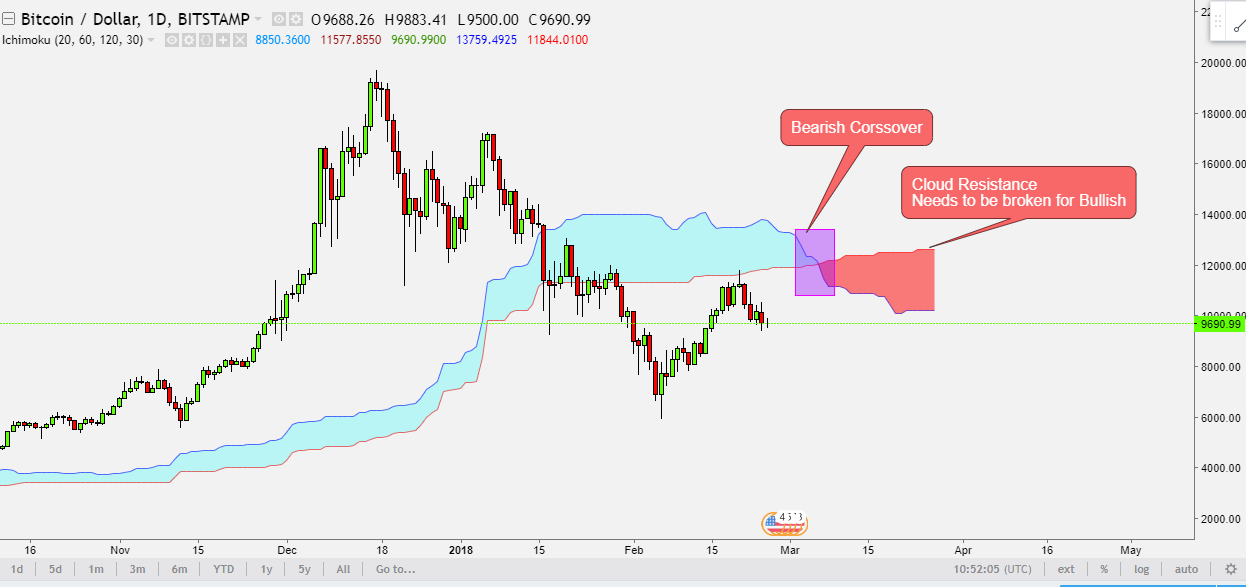
I again repeat that current trend of bitcoin is bearish. Many reasons to support that. We will not go bullish untill we break 13k where the cloud resistance is present.
After the trend the next question might be what is btc's next move. WEll I see it coming down to 4k region. I will discuss all signs showing me 4k.
1)Descending Channel:
Bitcoin has been moving in the descending channel. It has tested the upper line of channel 3 times and its down line 2 times.
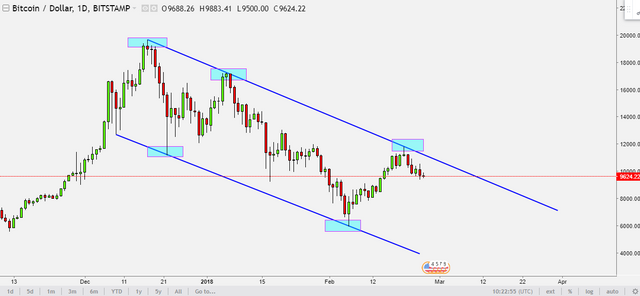
It should move in the channel and test some bottom. THe bottom according to channel is much lower then 4k but 4k seems to be the ulimate bottom.
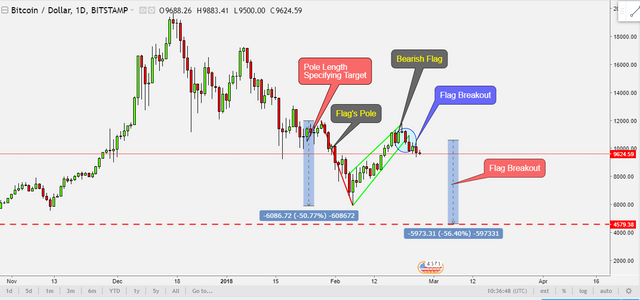
2) Bear Flag Breakout:
Bitcoin has broke out of the bearish flag. WHenever anything breaks out of flag the target is according to pole.
LEt me first show you the previous flag whose breakout caused it to dump to 5.5k.
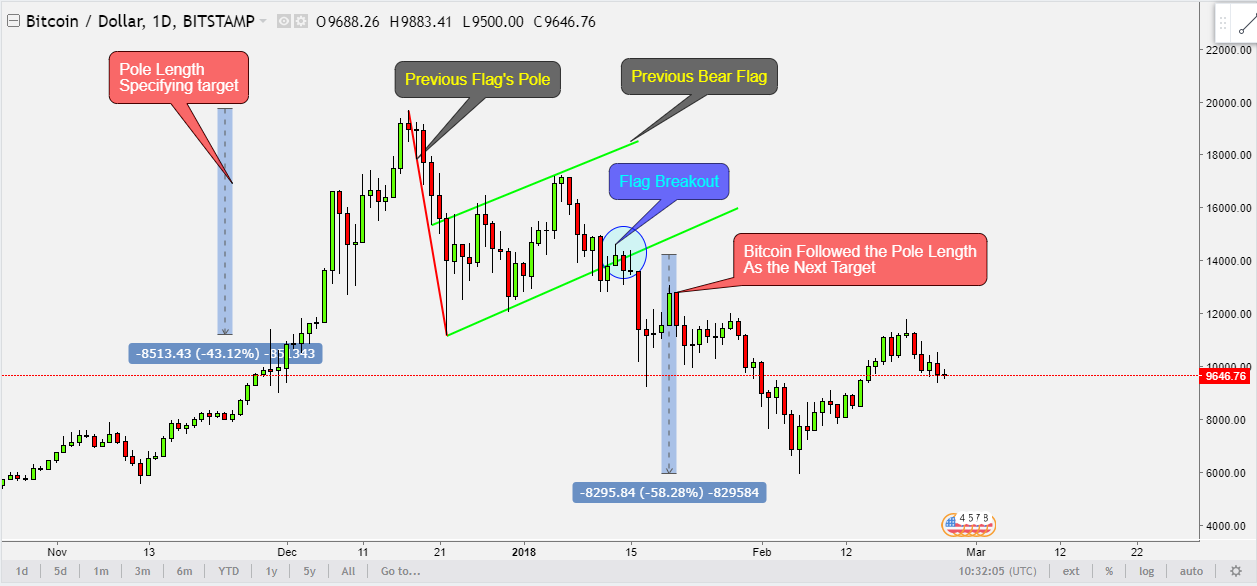
Thats how it followed the pole length to come down to 5.5k.
Now let me show you this time's flag and target.
Hope you get what I am trying to say.
3) Elliot Waves:
According to wave analysis we are in the 5th wave. This wave will end at some ultimate bottom around 4k.
Due to panic selling we might see under 4k.
4) Market Cycle:
If you have a second open up the daily charts of Nasdaq, Dgb, Xrp, Etc, Nxt and have a look at them. You will understand why the bottom is at 4k. What happens is that whenever price pumps extremely hard, Whales dont put their money in that asset/currencypair/cryptocoin until the price retraces back to 70-80%. Thats called the market cycle. You will understand that cycle. Something that is going up deosnt go up for infinity. It retraces after making ath. Take dgb for example. It was going up and up. A hype was created. And then it dumped so hard that those who bought it at 2200 are still holding it from June wand waiting for it to make an ath,
Thats the retracement for which I am waiting before putting my money in BTC.
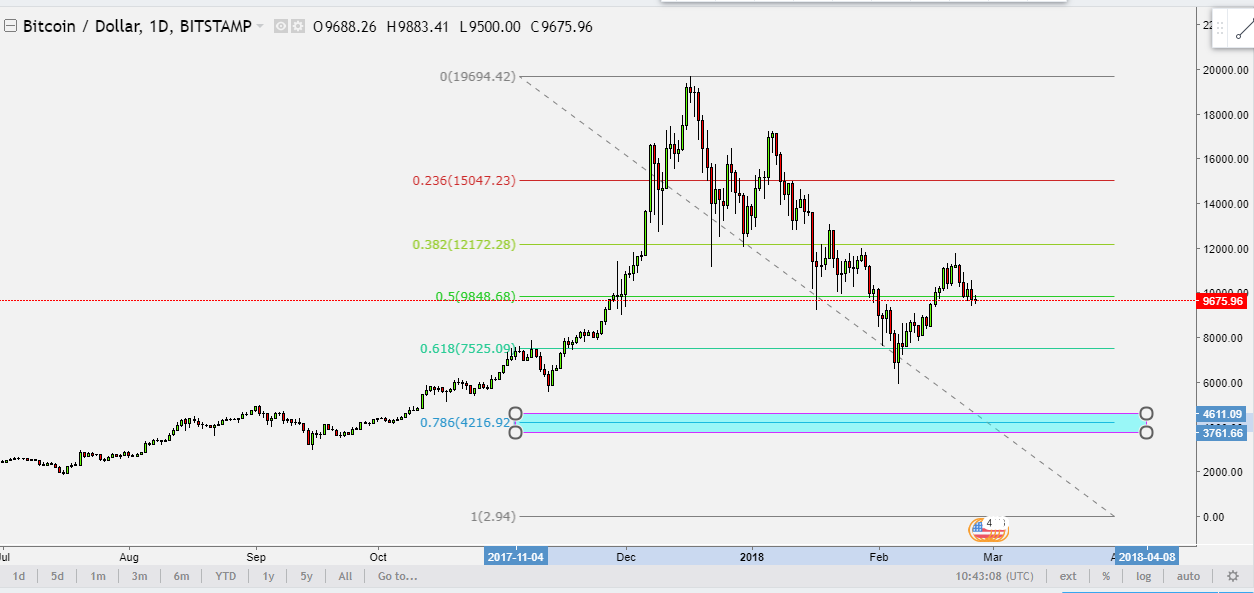
You will observe same cycle in above mentioned currencies.
In the Language of Indicators:
Lets talk about the present condition of BTC from the Indicators and OVerlays point of view.
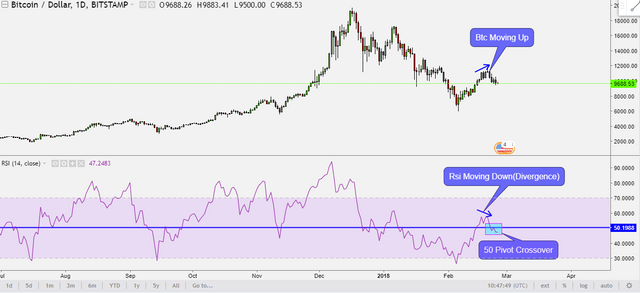
1) Relative Strength Index:
RSI move below 50 pivot. That is a bearish sign. Also there is bearish divergence showing Bearish Strong Sign,
2) Ichimoku CLoud:
The Cloud is showing bearish bias. Its red. Which is a strong bearaish sign again. Until we break the clod we are bearish, This is what I talked about in my 'CUrrent Trend Point'
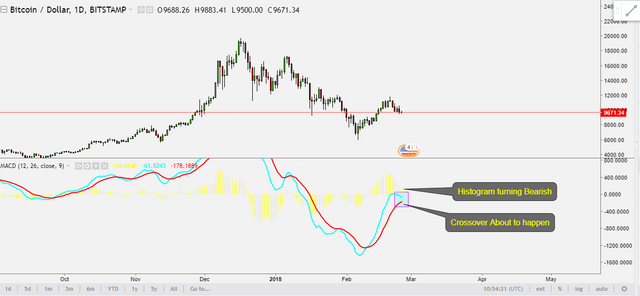
3) MACD:
The Moving Average Convergence Divergence signals are based on two things, The histogram and the MACD SIGNAL line.
We get a bearish sign when the histogram gets under 0. and The crossover happens between the signal and Macd line.
A similar situation is happening in BITCOIN.
4) TTM SQUEEZE:
The ttm squeeze indicator just got bearish in 1day BTC timeframe.
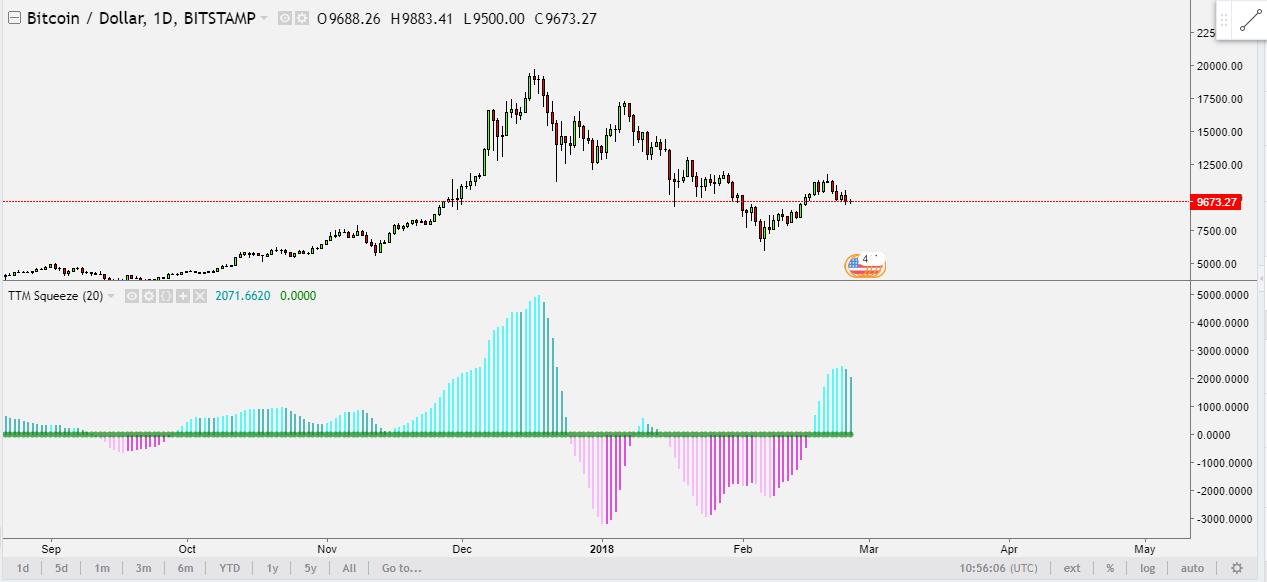
Just note the colour. It has chaned from aqua to dark aqua. Now it will turn to light purple when gets under line and then it will convert into dark purple when it will show bullish move.
SO that was all from the today's Analysis.
Note:
This is one day timeframe so move will take much time. 1-1.5 months. And there are supports present so it will have bounces also but a small bounce doesnt mean that the coin has gone bullish. Also this is just my analysis, Do your own research. Follow at your own risk.


Excelent job Done!
One of the most reasonable analyses posted here on Steemit. And is long term. Not as this spamming TA posts from greedy TA prophets posting 3 times a day and yelling about same stuff again and again. They are like kids! Posting just to get upvotes (self upvotes that i despise most and bot stuff or votes from other accounts they control) and grabbing SBD from reward pool, that can be distributed more fairly according the value of other much more valuable posts (like this one you posted).
Your point is clear and well evidence is provided to support it. I agree 100% with you. I have some coins still holding but I plane to sell them when Bitcoin will reach main support line. Your great analysis convince me even more and moves will be transparently demonstrated in my public portfolio i run along my analyses to make some practical guide lines to people willing to trade cryptos.
Smart money still waiting for weak to sell and drive price down.
See you around sun!
Thanks mate.. gave me much motivation