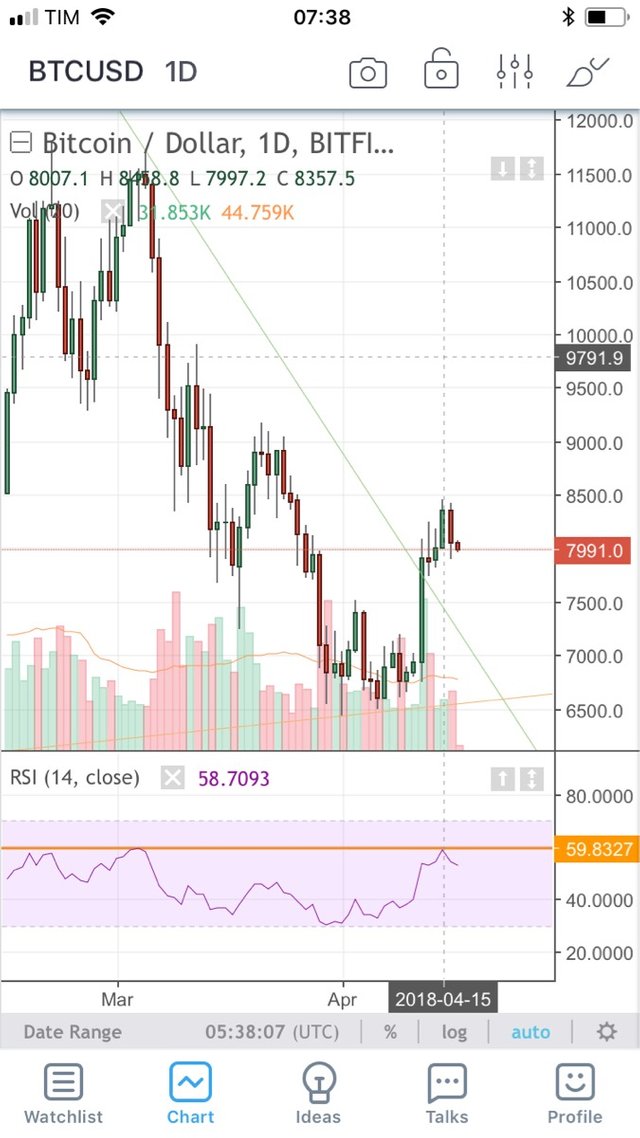
RSI COUNTS and Btc goes sideways. RSI indicator explanation, / L’RSI CONTA e BTC va orizzontale. Spiegazione dell'indicatore RSI.
English:
Rsi is a indicator which measures the
Momentum which is the price acceleration.
So if the prices stops, RSI decreases. Most of the time the patterns on RSI chart are similar to patterns on price chart but when they are different we have a “divergence” which is a strong technical analysis indicator. The most important divergences in trends are when RSI is in ipersold (under 30) or iperbought (over 70) zone. This means that lately the prices had a grow or a dump very fast and now their movement is slowing. This is a very strong clue of a price trend future change. Another use of RSI chart is to show trendline, support, resistances or TA patterns as they were on the price chart, several time they are more easy too see on RSI chart then on price chart. This is the case of today, as I already shown yesterday, we bounced on a RSI resistance which is very strong and is a clue that Bitcoin could be still bear.
RSI FORMULA:
RSI = 100 - 100 / (1 + RS)
Where RS = Average gain of up periods during the specified time frame / Average loss of down periods during the specified time frame/

Rsi was invented buy Welles Wilder, a very important American analyst who is still alive and lives in New Zeland now.
In his most important book : “New concepts in technical trading system” pubblished in 1978, he invented some of the most used indicators today in TA, such as RSI, ADX, SAR, volatility index and more, this is a absolute must read and one of my most beloved books.
I don’t only use TA and the finishing of the USA tax period and the upcoming Consensus in May tell me that probably we will have orizzontal trend period for the next 15 days.
A common error is to think that there are only two trend: up and down, they are 3 because there is also the orizzontal trend and in traditional financial markets it is the most common. This is also called trading range and when we are in one we can’t use well the trend following trading systems based on moving average, SAR or others, in these cases the best are the price oscillators like Stochastic, MACD le strategies based on the Bollinger bands.
Conclusion
Going back to our Bitcoin we can not be sure of anything right now but I think that Btc will build a Cup to get strength for the future growth after the big fall it had and it will explode in May whit the consensus and the big money getting in the market. Market cap is still very little compared to other asset class because it is not safe anough for ETFs and retail funds. Now they are building the infrastructure to make it safe enough such as Goldman Sachs buying Poloniex or Coinbase getting regulated and so we will have a big boom in the next months if SEC finally approves bitcoin ETFs.
Italiano:
L’RSI è un importante indicatore che misura il Momentum ovvero l’accelerazione dei prezzi. I valori di RSI vengono poi messi su un grafico a linea che spesso ha un andamento simile al grafico principale ma rappresentando la accelerazione quest’ultimo mostra ad esempio un trend decrescente quando i prezzi sono fermi su livelli simili : la accelerazione è infatti diminuita. I segnali più importanti che RSI ci da sono proprio queste “divergenze” rispetto al grafico dei prezzi che sono molto più significative in termini di capacità previsionale quando si verificano nelle zone di “ ipercomprato” o “ipervenduto” ovvero quando RSI è superiore a 70 o inferiore a 30 utilizzando i valori standard. Quando ad esempio il grafico di RSI si trova in ipercomprato ovvero sopra la banda orizzontale posizionata sul valore di 70 questo significa che i prezzi ultimamente sono saliti molto in fretta. Se a questo punto dopo una lunga e repentina corsa dei prezzi vediamo che loro continuano a salire ma RSI invece diminuisce formando una serie di massimi decrescenti e magari anche un taglio in discesa della banda a 70 allora abbiamo un fortissimo segnale di vendita.
Vediamo la formula di RSI:
RSI={100*U/}{(U+D)}} dove
U = media delle differenze di chiusura al rialzo di X giorni
D = media del valore assoluto delle differenze di chiusura al ribasso di X giorni
Questo indicatore è stato inventato da Welles Wilder ed esposto nel suo famoso libro del 1978 intitolato: ”New concepts in technical trading system”. Questo è uno dei miei libri più amati anche per lo stile coinciso ma pratico, basti pensare che inizia dicendo - parafrasando - che questo libro non è stato scritto per piacere alla gente ma per descrivere dei metodi di Trading definitivi. Beh questo libro oltre all’RSI introduce alcuni degli indicatori e delle tecniche più usate oggi nella analisi grafica come il SAR, l’ADX , il
Volatility index ecc.
Tornando ora al nostro Bitcoin e anche considerando che non uso solamente la analisi tecnica direi che siamo in una fase di enorme incertezza perché il rimbalzo su quella resistenza sul grafico di RSI è davvero molto significativo ma lo è anche il fatto che siamo già scesi moltissimo e anche il fatto che è finito il periodo di pagamento delle tasse USA che pare abbia causato parte delle vendite. Inoltre abbiamo il misery index creato dall’importante analista di Wall Street Tom Lee che è a livelli molto molto bassi il che è un fortissimo segnale rialzista.
Conclusioni:
Infine tutto sommato mi aspetto una fase laterale con magari una leggera discesa in modo da formare una coppa in cui BTC possa raccogliere le forze dopo il forte crollo e poi una forte ripresa a maggio quando si terrà il Consensus a New York e probabilmente arriveranno grosse novità sul l’ingresso dei big money ovvero i fondi comuni nel mondo Crypto. Oggi la capitalizzazione dell’intero mercato è bassissima paragonata quella delle altre asset class per via del fatto che i big money non sono ancora entrati ma ormai si intravede l’ingresso da segnali come l’acquisto di Poloniex da parte di Goldman Sachs o gli sviluppi in regolamentazione di Coinbase. Queste cose servono a creare un mercato sufficientemente sicuro per i fondi comuni ed ETF che fino ad adesso sono stati respinti dalla SEC proprio per questa carenza infrastrutturale che rende l’investimento ancora troppo pericoloso per gli utenti retail.
Legal Disclaimer: All my analysis are just showing possibile scenarios and not predicting the future. Technical analysis gives wrong signals very often and it just give clues to reason on the future development of a financial product. The price move often in a unpredictable way. Never invest basing only on my predictions which can be wrong and always use a correct money management. I do it for personal interest for free, I am not a financial advisor nor is any content in this article presented as financial advice. The information provided in this blog post and any other posts that I make and any accompanying material is for informational purposes only. It should not be considered financial or investment advice of any kind.
 Steepshot |
Non sono molto ferrato nell'argomento ma penso di aver capito buona parte delle cose che hai spiegato, complimenti perché ti esprimi con semplicità su un argomento che non è per nulla semplice per un profano...
Hello luigiborla!
Congratulations! This post has been randomly Resteemed! For a chance to get more of your content resteemed join the Steem Engine Team
...azz... ma sei un vero esperto...!!
Sono un esperto di tutto ciò che è inutile e rischioso , come l’alpinismo ;)
Goldman Sachs
or Goldman Sucks?