Bitcoin Trend Series / EP. 526 / Reverse H&S Pattern & Elliott Wave Theory
Time: 7.55 A.M. / GM+2 / 13th Mar, 2018 – Tues.
In our previous post / 525 / we had forecast the trading range will be between 8.60K and 10.15K, the intraday high was 9.90K, and the low was 8.77K, and as we wrote:
"The reason why I believe, the price might test the bottom at 8.4K area again, followed by climb toward 10.15K."
The price started to move toward 8.4K but due the strong buy on the way, the price hit 8.77K and climbed again.
Bitcoin price looks ready to resume its climb, supported by Reverse H&S Pattern & Elliott Wave Theory, but technical indicators are giving mixed signals:
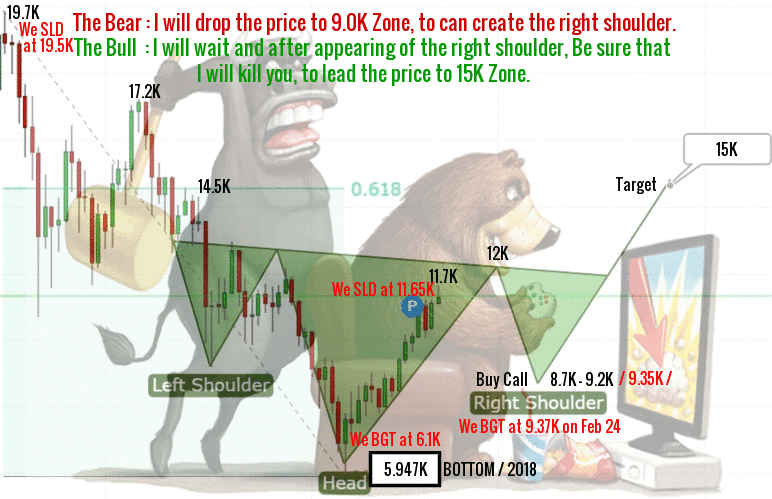
I) Reverse H&S Pattern:
The bears were unable to take advantage of the breakdown below 9.675K on March 10, as the price quickly recovered on the next day, March 11, due to strong buying support at 8.4K.
Bitcoin market have been seeing lower volume in trading and cheaper fees, continued to struggle to regain its value continue trapping it between 8.4K and 9.9K.
An advance over 11.7K will complete the reverse H&S pattern, two-months in the making ( We did draw the below chart on Feb 21 ). As soon as right shoulder will be formed, the target mostly will stand around 15K.

II) Elliott Wave Theory:
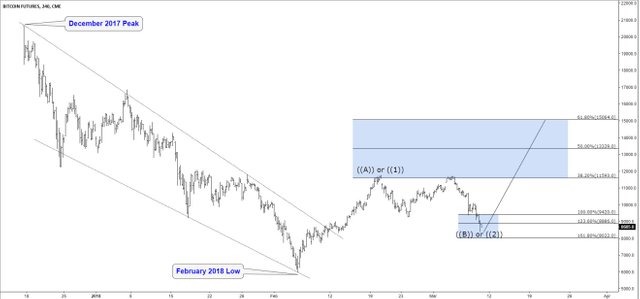
Since December 2017, the price dropped for 2 months before finally bottoming on February 2018. Up from 6k, Bitcoin started a new cycle to the upside / wave (1) / that is already in place and to the downside / wave (2) / currently ending around 8.340K, then it’s expected to resume the rally toward 15K.

Bitcoin is currently trading around 9.37K at time of writing and the trend is bullish for today, conditioned by stability above 8.4K.
8.4K ( 61.8% retracement level ) is an important support. Based on fib retracement, MA100, and Elliot wave.
Note:
- If you are trader and you BGT at 8.4K, move your SL to 8.242K.
- If you are investor, HODL.
Support : 8600.00 level (Major).
Resistance : 10150.00 level (Major).
Expected trading for today:
is between 8600.00 support and 10150.00 resistance.
Expected trend for today :
Bullish
Medium Term:
Bullish.
Long Term:
Bullish.
The low of 2018:
5947.00 / IHS Bottom.
The high of 2018:
25000.00 level / Expected.

The reverse head and shoulders had formed perfectly a few days ago till the bear whale / Binance / SEC fud caused a spike down. Hope you are right that it can still complete.
BTC need one good push to pass 10K level, which may starts its bull run towards 15K...
Bitcoin rate is playing between 8k to 12k. Is there any possible to rise in march?
Excellent analysis on bitcoin, bitcoin is breaking down
Thanks for sharing
I really hope you are going to be right. The bears i also follow are still pretty sure we are in bear trend :( Only time will tell in the end i guess. Have nice day all.
Great post it is about bitcoin
thanks for sharing
Thanks for the updates @lordoftruth and for the future predictions for Bitcoin investment and other cryptos. Am now in a better position to make a wise informed decision on which coin to invest in. I like that bullish tendency of coins. Hope to make some profits thereafter.
seems like good at the moment don't know what's gonna happen
Nice post
your post about bitcoin is very important.