The Effectiveness of "Pivot Trendlines", Using Bitcoin's Current Price Data
Coming at the markets from a technical analysis (TA) approach, there are many useful tools when it comes to making the most informed trades. If you've read any of my previous TA based posts you're likely to have come across the idea of "building a case for entry", using "confluence zones" as areas to consider making a long/ short entry.
If not, I'll give you the short of it:
Common TA tools to determine relatively high probability pivot points (think of it like a price level that we expect to get a good "bounce" into profits) in price include "tests" of:
1.) fibinocci retracement/ extension tool(s) levels
2.) horizontal support/ resistance lines, also "pivot lines (zones)"
3.) trendlines (TL)
4.) major moving averages (such as the 50 and 200 simple moving averages)
...among others.
The more of these "probable pivot" indicators that fall within a relatively small price range, the more "confluence" it has -- if two or more of them come within a small price range, it's called a confluence zone. The idea is that the greater the confluence, the higher are the odds that price makes a significant bounce into profits and the reasoning is simple: a large number of traders rely on these tools to determine when to buy/ sell, so having more of these tools come into play at once likely means that more traders are getting the signal to make an entry.
With that Outta the Way...
I'd like to now offer up another one of my go-to tools for determining the level of confluence, or probability of a favorable price movement -- the "pivot trendline" (PT).
The PT is a hybrid between the common trendline (a slanted line along which at least three price lows touch in the case of an uptrend line or three price highs touch for a downtrend line) and pivot line (price level that gets tested at least twice from one side and once from the other, but may be tested many times from both sides). It's a TL that "fails" at some point (price breaks through the TL) and gets tested one or more times from the "underside" (assuming it was an uptrend line).
The more times these PTs are tested from either side, the "stronger" they are considered to be, the more we can expect them to behave as a "magnet" to price and support/ resistance to future price tests.
What do these pivot trendlines look like in the real world?
Allow me to demonstrate for you :)
4-Hour Candlestick Chart of Bitstamp!
What am I Looking At?
On the above chart, the up-sloped black line is a traditional trendline, specifically an uptrend line (three or more lows test the line, without breaking through). All of the red sloped lines represent PTs. I placed small black arrows on the chart to point out specifically where price tested these lines and you'll notice that these tests come both from above and below them, which is what distinguishes them from the regular ol' trendlines.
The big bold black arrow points out the PT that I want to bring your focus to for the moment.
Notice how this line already qualified as a PT by the time that the third test came, around early to mid May -- two tests from below and then one from above. Also notice the relatively big bounces that price got from those test points. This is another important thing to consider along with the number of tests -- how strong are the bounces? The stronger they are, the more assured we can be that it will hold up in the future as a pivot point and that we'll get another strong bounce in a future test of that level.
The usefulness should become clear once you study the result of the fourth test of that line (the fourth arrow when looked at from left to right). Notice how it almost perfectly marked the major price low in mid July for what would have been an insanely profitable long entry.
It's also worth noting that price is currently testing one of the PTs and that we have somewhat of a confluence zone between a couple of these PTs and a trendline.
Disclaimer:
This is not intended as trading advice. It is only meant to be used to edu-ma-cate youself, foo!
Upvoted. what will be the ceiling/resistance target?
NOTE:
I'll be 100% upvoting this post in a few hours from now to give all voters up until that point a nice, healthy curation bonus :)
...this is the same approach that I take on all of my posts, btw. I'll always give people a big time window to vote on my posts before I slap it with my own 100% upvote. Yes, it rewards me, but, more importantly, as I see it, anyways, it rewards my up-voters.
thanks, upvoted and following
thank you,,,,
so you're actually a trader?
Yes, believe it or not. haha
i have no reason to doubt that
i do remember that perhaps this is what your passion is actually about?
I'm kind of a funny guy when it comes to passions. It kind of comes and goes like seasons and changes without reasons, haha. I do have fun with trading though, which is why I've mostly stuck with it through the years. The extra money is nice too :)
I think my one big problem to deal with in this life of mine is my seriousness, and by that I mean lack of it. I don't put much value in anything and don't take too many things seriously. And for that reason it's hard for me to keep my ambition for a very long time -- at a point it begins to feel like a joke, like "why am I even doing this? Do I really even care about making my goals?" At moments the answer is a resounding "yes" and others, I'm just "meh."
I can see when looking back that it has all amounted to a lot of time wasting, going back and forth between making great efforts to "achieve greatness" and then settling back to not caring, but, for whatever reason, seeing that isn't enough for me to change the pattern.
And the funny thing is, most times I reflect on all the time wasting I just laugh. I feel sometimes like I'm wasted talent, but then I think "does it really even matter?"
I'm going to die sometime in the future, probably between the ages of 80 and 95 years old, and it really won't matter at that point what I did or didn't do. So why worry? That seems to be my motto up to this point in my life. Why worry?
Cuz one thing that I am most of the time is stress free and relaxed, and that feels good :)
Maybe my passion is just to feel good? It sounds simple and maybe a bit unambitious, but, like they say, actions speak louder than words.
I can relate about striving hard for my goals and getting frustrated feeling like s*** on some days and being just a couch potato or a worry free lass on some other days, too but if there's one thing I put as a reminder to myself these days it's to live in the moment so .. it doesn't matter much whether I make it big or not - it does matter but not that much to drive me crazy besides - YOLO so let me raise my glass on your passion of being worry free - Cheers!
Yes, living in the moment is very gratifying most times and, as I see it, it's the most effective way to emotionally and psychologically heal yourself.
The rest I couldn't have said any better, so I'll just say "I agree".
Thanks for the toast - cheers :)
Exactly! And we can use pivot points as entry/exit points. Thus enabling us to create a game plan with appropriate risk-reward scenarios.
Yes, very similar to the price channel and moving average envelopes strategies. Be on the right side of the waves!
Hi Jaemsbrown (a great singer by the way!)
I agree with most of your support lines. For me, on a downtrend, I also use horizontal support lines. All dotted lines are my addition. I see three primary supports and for me these are more prominent than the slanted support lines. This because the slant support lines miss much of the horizontal support regions or only briefly touch them. I've also drawn my Elliot Wave projections of a probable abc correction using these horizontal supports. The first possible stop for c is at around $3,175 as marked with (c?) and the second is $2,000 or so as marked with (c??). There could be a panic overshoot below the lowest dotted black support, but a brief one. I see this scenario as my probable and so primary count.
If there is a b wave bounce at the first dotted black support, this could result in a potential Head and Shoulders Top pattern as noted by LS (Left Shoulder) and Head (H) and Right Shoulder (RS) peaks. Note that your top most red line support would make a fine looking Neck Line to this H&S Top pattern.
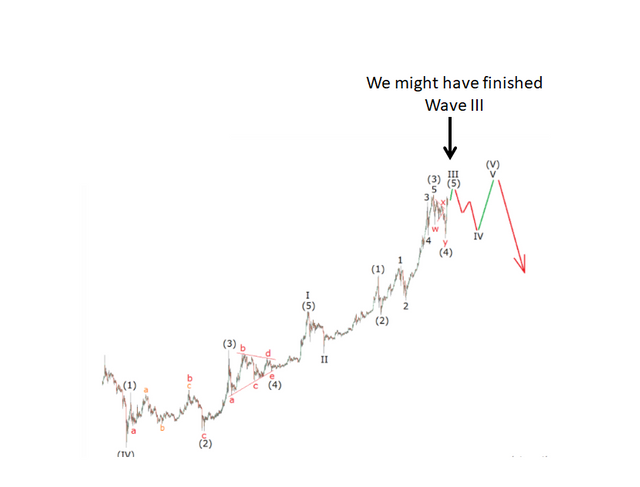
On a longer term, here is the Elliot Wave count I use as base guide. We have either completed or close to completing Wave III and so a Wave IV sizable correction is due as shown in chart below. My abc correction is an attempt at defining the pathway for Wave IV. Once this is in, the Wave V to perhaps $7,000 or higher.
Thanks for that detailed analysis, @haejin.
I'm on the look-out for heads and shoulders, too. I've never been an elliot wave guy, as I think there's too much subjectivity involved, but I've known a few traders in the past that have had decent success with it as part of their trading tools, so I see enough value in it to not reject it out of hand.
Every winner for past 10 years of the global trading championship has been an EW practitioner, respectively.
I never heard of that event, but, wow, yeah that probably isn't a coincidence.
In my own experience with EW traders, they're constantly adjusting wave counts in hind-sight to make the data "fit". I see that and I think to myself "how many bad trades happened based on the previous wrong count?"
But, I admit, I've never given it much chance to work for me, even though I do understand the basic rules and try to get in where I calculate a third impulse wave to be starting (so I guess you could say that I use it?). Maybe I should have taken it more seriously.
I know exactly what you mean. EW is an art and just like any art, it depends on the artist. I don't rely on the micro counts or complex corrections. I basically look for the abc corrections and once c is close to a bottom, I ladder in my entry in other words scale in or spread my buys. After abc correction is always a reversal and play that for the impulse five wave up. I did this with Bitcoin's July bottom to recently and sold at >70% profit. Not too shabby.
I hear ya and I agree on the artist comment. That's true of all TA, really.
This ABC correction strategy certainly makes sense. Basically a relatively high probability reversal, "counter-trend" trade or "trend-continuation" after correction, however you prefer to look at it.
I can definitely see your method complementing my own style very nicely, especially since I'm pretty sure that I already intuitively read the market similarly to your EW method, probably from having so much experience with reading charts and noticing patterns.
Nice post, thanks!!!
Upvoted.
upvote my friend.