BTC chart review February 11th, 2018 19:15 PST

Hello all, I've been watching the BTC price along with a lot of people that are invested in the coin. Not only does the price of BTC affect the money you have invested in it, BTC affects the entire crypto market. Many of us have 'alt' coins/tokens and the value typically rises and falls with BTC.
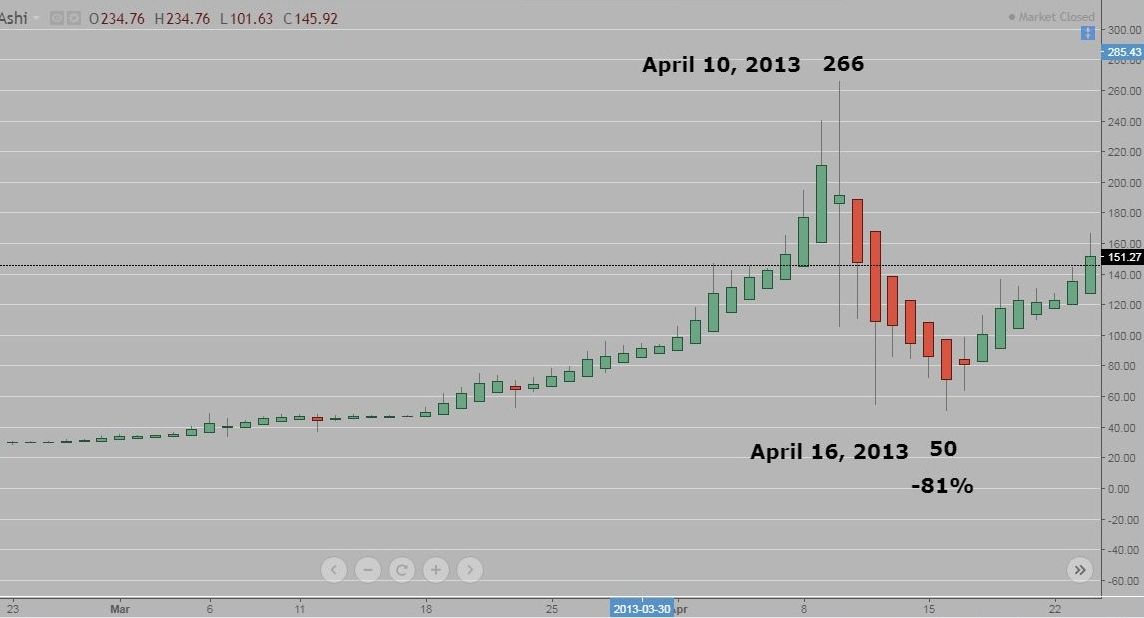
First, just as a reminder that BTC has very high volatility associated with it as it has spike up and crashed down quite a few times over the years. Here is a chart of a spike up/crash in 2013. From the top to the bottom was an 81% drop, crypto investors need to stomach that type of movement if they are going to invest in this market.
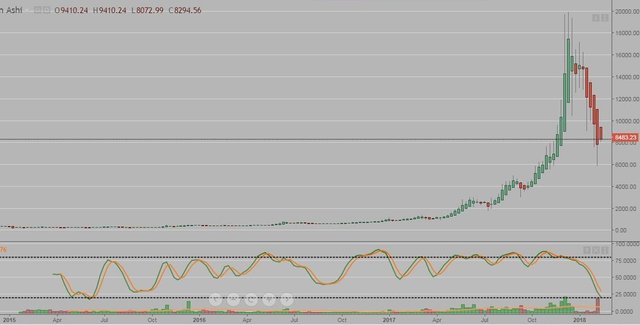
Here is a weekly chart of BTC, if you look at the Stochastics, it has dropped down to the 20 level. BTC has not seen the Stochastics this low since June of 2015. This is actually a good thing as there is no asset that continues on a bull trend 100% of the time.
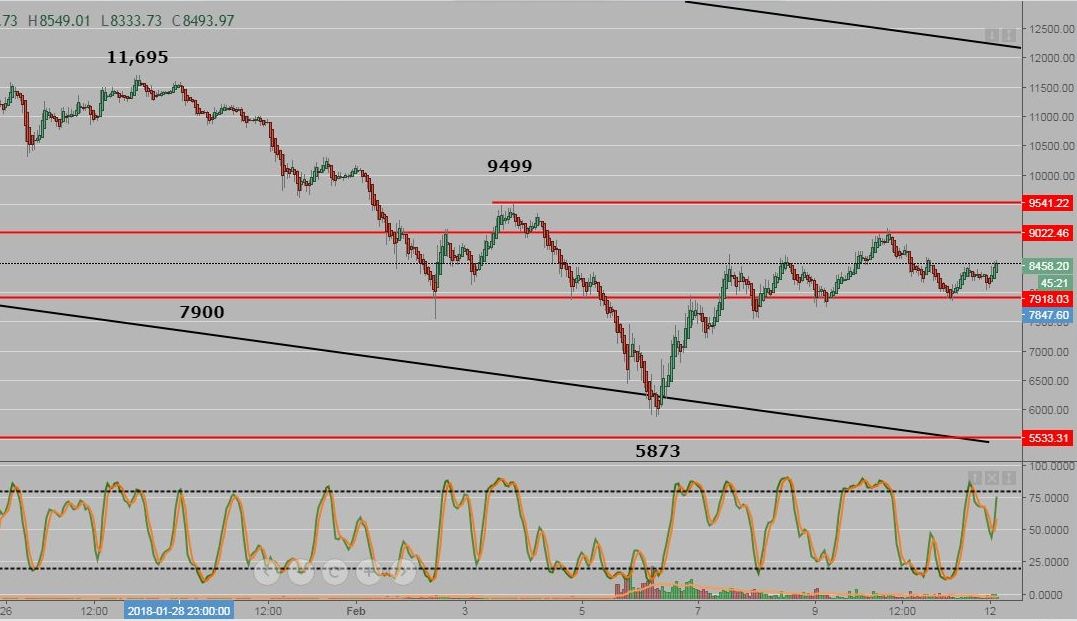
Here is the daily chart (GDAX exchange) with a Heikin Ashi overlay on the candlesticks. It has rebounded off of the spike low bottom and appears to be in a trading range with support at the 7900 level. (A high produced in November 2017)
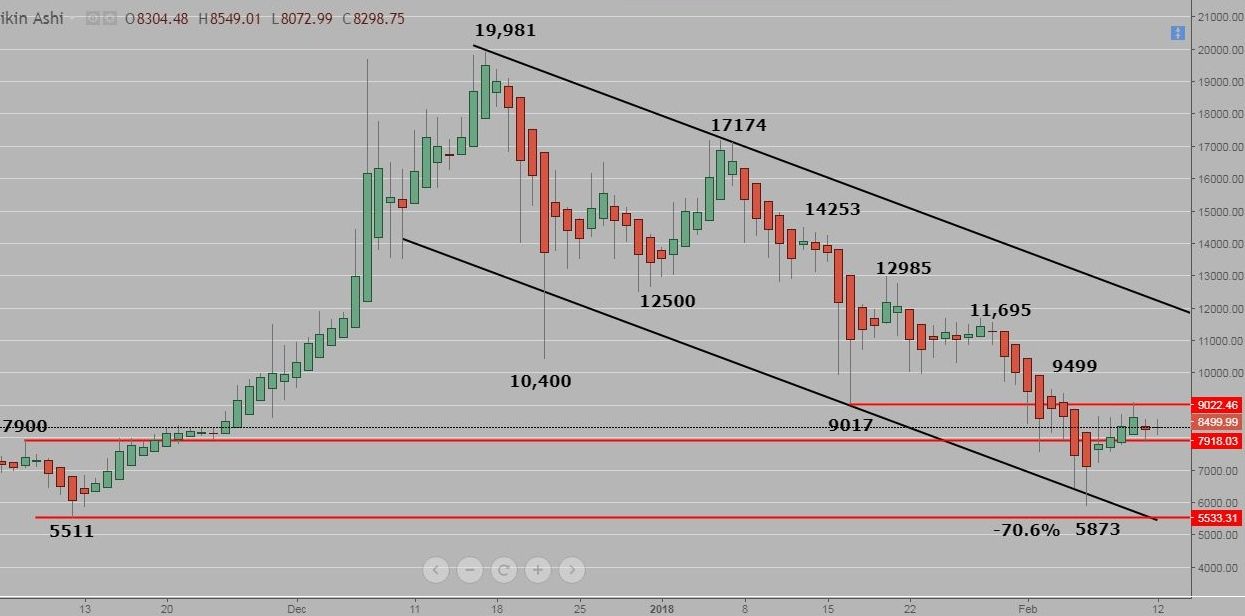
The 4 hour chart shows the channel it is trading within. There was a spike low in January of 9017 which is now providing a resistance level.
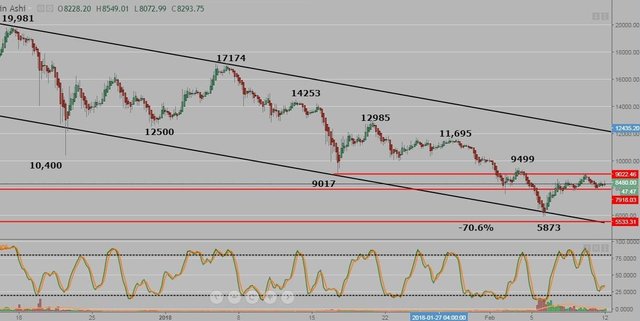
One hour chart (close up view). BTC will be testing the 9017 level again or multiple times before breaking through. (If it is to continue a bullish trend of higher highs) If it does get through that area, the 9499 is the next resistance point.
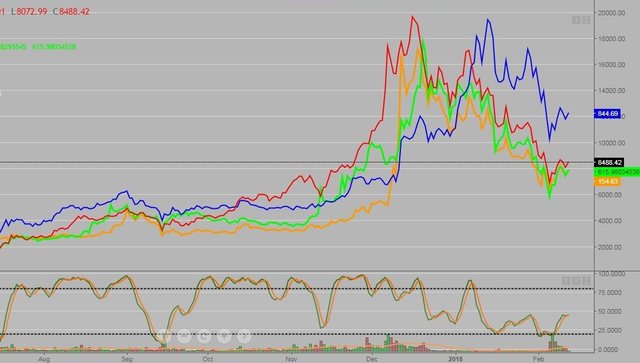
A daily line chart of:
BTC in Red
ETH in Blue
Dash in Green
LTC in Orange
They are fairly correlated, ETH lagged BTC to both upside and downside.
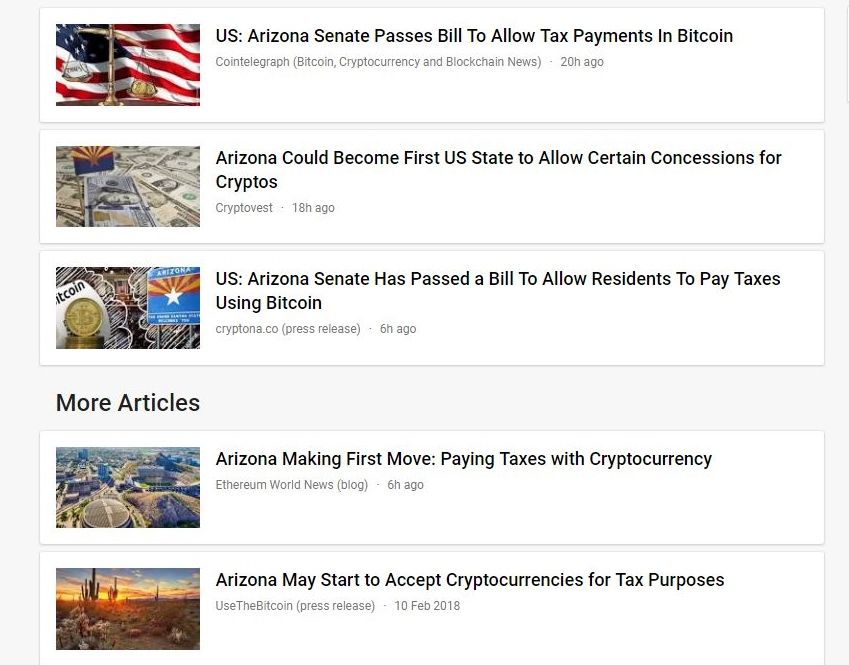
The adoption of BTC within the United States is definitely a reality as the state of Arizona has produced a bill which would allow BTC to be used to pay taxes.
HodL on tight, 2018 is going to be an interesting year!
I like your charting since you make it very clear and understandable.
BTC could come down to 7910.03 and bounce up then, could bounce down past it to 7847...if it does I would buy more. ....just my opinion
I'm glad you found the charting easy to read, in general simple is better. But technical analysis gets pretty confusing once you add in a bunch of indicators. I personally think BTC is on a slow grind back up, Feb 6th was the bottom for 2018.
Thank you for sharing, your post is really good and really understandable. I would rather to buy BTC at dip and just HODL, I am bitcoin believer. In my opinion, btc has possibility to make new all time high by this year, maybe around $ 80,000 (just prediction). I also have a prediction about btc price in February 2018 please proceed to here, if you wouldn't mind. :-)
BTC may climb to the previous high this year, it is difficult to say as it is so volatile.
Coins mentioned in post:
This post has received gratitude of 3.34 % from @appreciator thanks to: @glennolua.
You got a 2.89% upvote from @buildawhale courtesy of @glennolua!
If you believe this post is spam or abuse, please report it to our Discord #abuse channel.
If you want to support our Curation Digest or our Spam & Abuse prevention efforts, please vote @themarkymark as witness.
You got a 2.07% upvote from @postpromoter courtesy of @glennolua!
Want to promote your posts too? Check out the Steem Bot Tracker website for more info. If you would like to support the development of @postpromoter and the bot tracker please vote for @yabapmatt for witness!