Forecasting Bitcoin Prices (FEBRUARY 2018)
-What do we want to know?-
We would like to know the projection of BTC price in February 2018, both of its possible market movement and trend. The calculation method is similar with the previous calculation which is described in my previous post. The difference is only the input data, in this calculation I utilized historical data of BTC/USD Market Cap from 27 December 2013 until 31 January 2018. Thus, the output from this calculation would be :
- The possible price range for Feb 2018
- Possible region for enter market (buy BTC) in Feb 2018
- Possible region for exit market (sell BTC) in Feb 2018
- Possible trend occurs in Feb 2018
-Overview in January 2018-
The last market movement of BTC/USD in January 2018 was not really good. The sellers dominated the market, so the price went deeper. The trend was considered bearish with slope approximately -0,0062 (in logarithmic scale), in other words around $ 3,156,000,000 / day was lost from its Market Cap. The highest price was around $ 17,526 , exactly at 7 Jan 2018. Meanwhile, the lowest price was around $ 10,110 , exactly at 31 Jan 2018. The overview could be summarized in the following table.
1. The Possible Price Range for February 2018
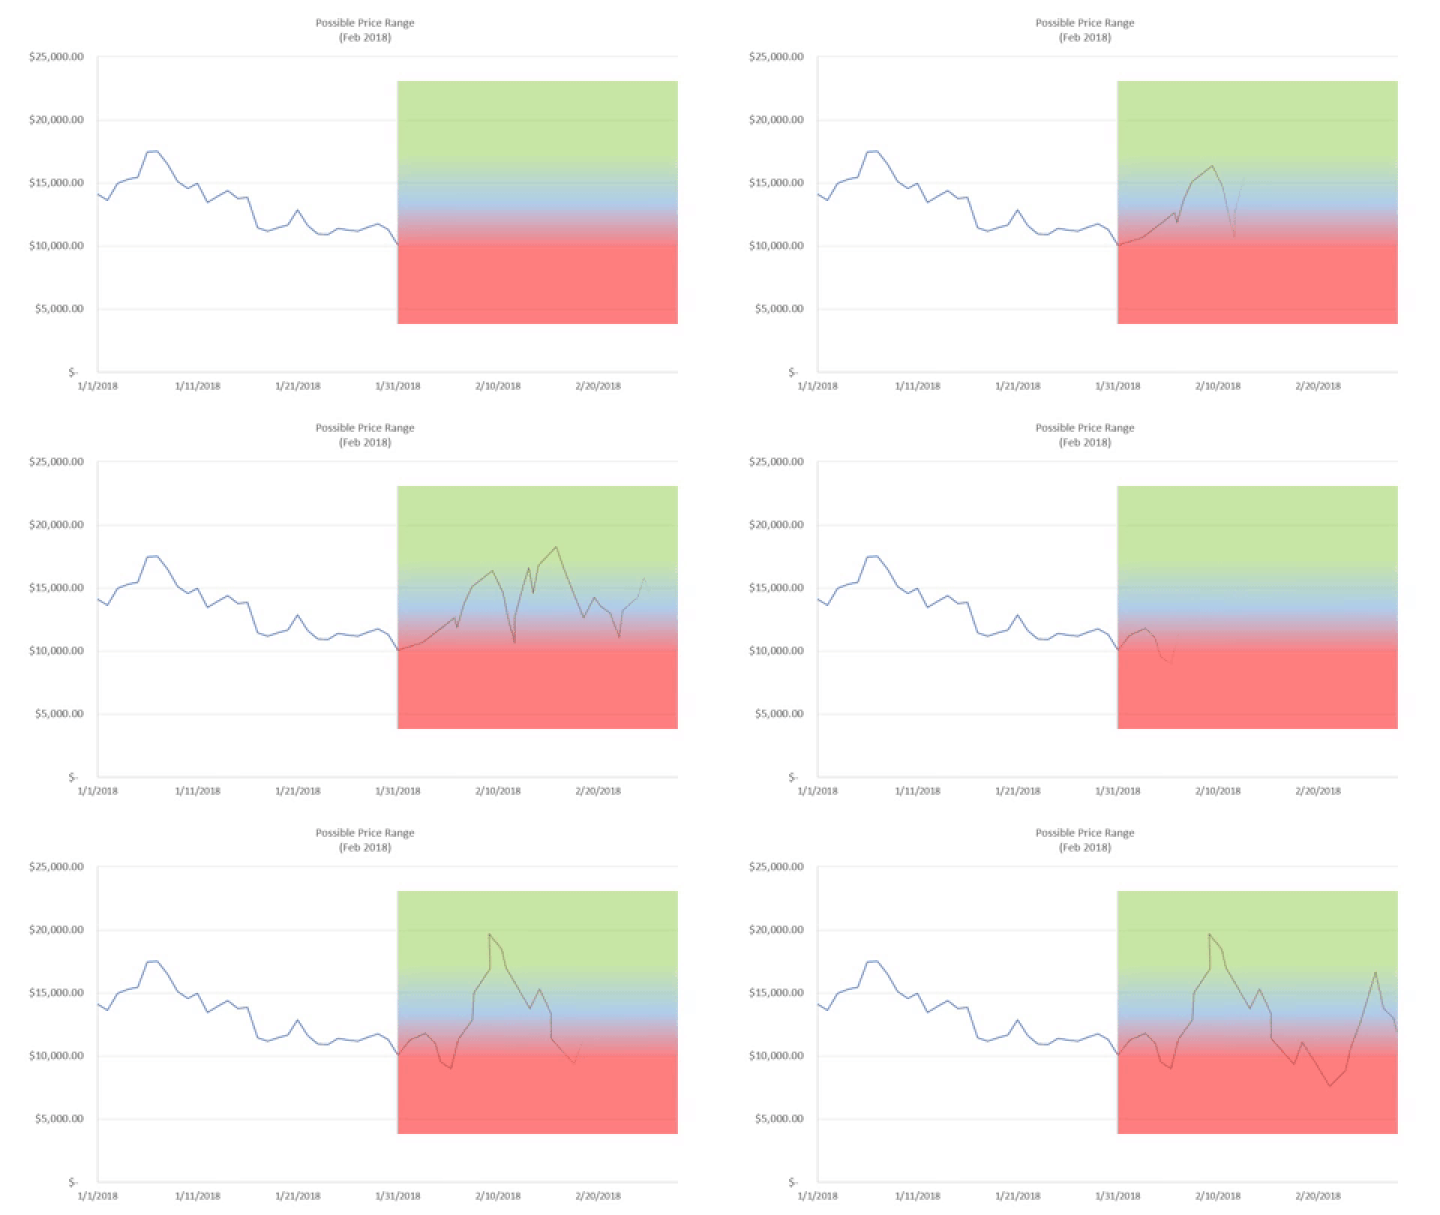
According to the result of simulation, the market would possibly move inside $ 4,461 - $ 23,250 in February 2018, as seen in chart below.
2. Possible Region for Enter Market (buy BTC) in February 2018
If you are kind of Bitcoin believer, buying at the dip might be a good opportunity to enter market while it is in bearish condition. Buy bitcoin at the dip and HODL , until the market reaches new all time high. According to my previous post, bitcoin still has a possibility to reach new all time high price in 2018, approximately up to $80,000. Thus, based on the simulation, I have summarized the good and possible regions for buying bitcoin in this month.
So, if you want to HODL Bitcoin, you could place your limit orders at those regions ONLY in February 2018.
3. Possible Region for Exit Market (sell BTC) in February 2018
This is the possible high prices that might be occurred in February 2018. One thing to be noted, I putted the possible New All Time High in 2018 (see my previous post) in the table which I have summarized below, due to we never know exactly when is the New All Time High would be occurred. So, we also have to anticipate it.
Those regions are recommended to be taken into account in February 2018.
4. Possible Trend Occurs in Feb 2018
According to 40,000 steps of simulation which I have calculated, the probability of bitcoin price would having uptrend, downtrend, and sideways are 55%, 44%, 1% respectively. In my opinion, we still have to aware of downtrend that might be occured in this month due to the difference between probability of uptrend and downtrend is considered close enough (around 11%).
-Enclosure-
I am not a financial or trading advisor, I am just an ordinary engineer who have interest in cryptocurrency. By posting this result to steemit, I just want to share what I have done in my leisure time. I do not enforce you to trade or investing in my way. Every people has their decision and unique trading way. Thank you for reading my post. Enjoy your crypto!
BTC : 1KZQipWvGBL6PijbeE1QEGMDpe18U9zJkY
ETH : 0x9f7d072e407d2f79ea165a02b38c8d05d1fcd3d2


Great post! love the way you are going about predicting the price.
JRcrypto