Bitcoin technical analysis, Sept 16th @ 6:30am PST

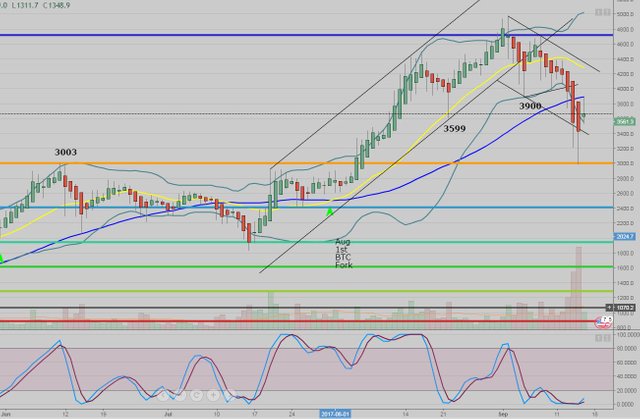
- Heikin Ashi overlay on candlesticks - After a huge spike down and reversal, a new green bar has been 'printed'. One green candlestick does not indicate a trend change but may be a signal for further upside potential. Neutral
- Bollinger Bands - Widening out with the downtrend, had 3 bars below the lower band and the current bar just inside, neutral/bearish
- Moving averages - Price is below the 20 dma and 50 dma, bearish (The 20 dma is still above the 50 dma)
- Trend - Price is trending lower with lower highs and lower lows. Bearish
- Stochastic/RSI - Both K and D lines are under 20, the K line is just arcing up which may suggest the start of a trend higher. Bearish
- Trend lines - Price has remained within the bearish channel for the most part with the exception of 2 days that spiked below the lower trend line. Bearish
- Support/Resistance areas - Downside support was the June peak at ~$3003 which may be the bottom of the current downtrend. Upside resistance is the 50 dma (which it has already touched and dropped back down) and the 20 dma.
- Fibonacci - The fib that I have on this chart has the lows set in 2015 around the $220 area to the high of $3003 (Orange line). This produced a 1.618 target of $4716 (Blue line) which it hit and is now a resistance level.
Thoughts - China will have 2 exchanges shut down near the end of Oct, Huobi and OKcoin while Yunbi is scheduled to shutdown on September 20th. This may have spurred a certain percentage of the Chinese to sell off their BTC, but I'm sure many have held onto the token thinking that they can sell them in the future on another exchange outside of China if necessary.
BTC may have reached the short term bottom with the spike low to ~$3000 yesterday as it tends to move very quickly to support and resistance levels. Asset prices tend to take the 'stairs going up and the elevator going down', so getting back to $5000 may take a little time as price needs to get through a variety of resistance levels.
I think technical analysis can be used with crypto's and BTC as it can provide a look into the near term future trend, but it is one of the most volatile assets that I have ever seen. (I have just been looking at the cypto charts since July) The price action tends to overshoot targets to both upside and downside. The spike highs and lows are over within a few minutes, so trading the token near these levels is very difficult for those not watching the market.
My previous BTC analysis on Sept 11th
https://steemit.com/bitcoin/@glennolua/bitcoin-technical-analysis-sept-11-2017
Ref: Top photo bitcoin image from Coindesk
@originalworks
The @OriginalWorks bot has determined this post by @glennolua to be original material and upvoted it!
To call @OriginalWorks, simply reply to any post with @originalworks or !originalworks in your message!
To nominate this post for the daily RESTEEM contest, upvote this comment! The user with the most upvotes on their @OriginalWorks comment will win!
For more information, Click Here!
i`ve up voted and followed you. waiting you :))
This post recieved an upvote from minnowpond. If you would like to recieve upvotes from minnowpond on all your posts, simply FOLLOW @minnowpond
This post has received a 0.98 % upvote from @booster thanks to: @glennolua.
Didn't even get what I put in back...lol
Your .98% is like .70 cents