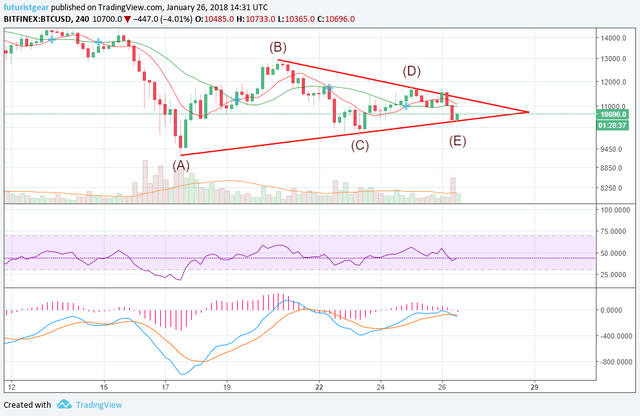
Bitcoin Has Touched The Bottom Of The Triangle!
Traingle Almost Completed!
It seems that some bad news for a XEM exchange resulted in a drop in a lot of cryptocurrencies.
News aside, the technicals I posted yesterday pointed to another move lower in order to complete the triangle pattern.
Here's how it looks now:
https://www.tradingview.com/x/tUPVywN4/
4 Hour Chart
The "E" area has now been hit, and I am guessing that this triangle will now be broken to the upside.
We need to see the MACD cross back to bullish and the RSI level to get higher before that happens.
The breakout will also need to be accompanied by stronger volume in order to confirm the move, otherwise we could be faced with another fakeout situation like the ones @pawsdog has been covering here.
Remember to keep an eye on it, it can also still break downwards if the indicators remain bearish. Here's a quote I've just read:
The secret of technical analysis is to wait for the market to talk before trading and continue to listen in case it changes its mind.
I think that sums it up perfectly.
Thanks for viewing!
For more great technical analysis and crypto related posts, see also: @toofasteddie, @gazur, @ew-and-patterns, @pawsdog, @cryptomagic, @exxodus, @beiker, @allthereisislove, @lordoftruth, @masterthematrix, @cryptoheads, @tombort, @maarnio, @steemaze & @briggsy
Not investment, finance or trading advice.

I'm still expecting to see a lower low in BTC Price. I think the next trend move is just around the corner... we will see where Bitcoin goes next!
We certainly could! That triangle could always break lower...
I hope it doesn't, but we'll see. :-D
I invested in bitcoin when it was 1500$ and i dont know how much i dont know how much i have to lose more....
Btw informative post
Thanks for the update
Nice post. Good analysis.