Bitcoin TA - summary of analysts - 23. Mar 18
Regular daily update on BTC ta analysts opinions.

My summary - short-term sentiment: slightly bullish (last: slightly bullish)

- We pull back - probably more than expected. So the question is do we go down the uptrend at around 8'100 which will be again a very critical test or do we turn at around 8'250 and go to the upper channel at around 10'000.
News about the blog
- I will be traveling again starting Saturday for two weeks. Expect the timing of the overview to vary in that time frame.
Analysts key statements:
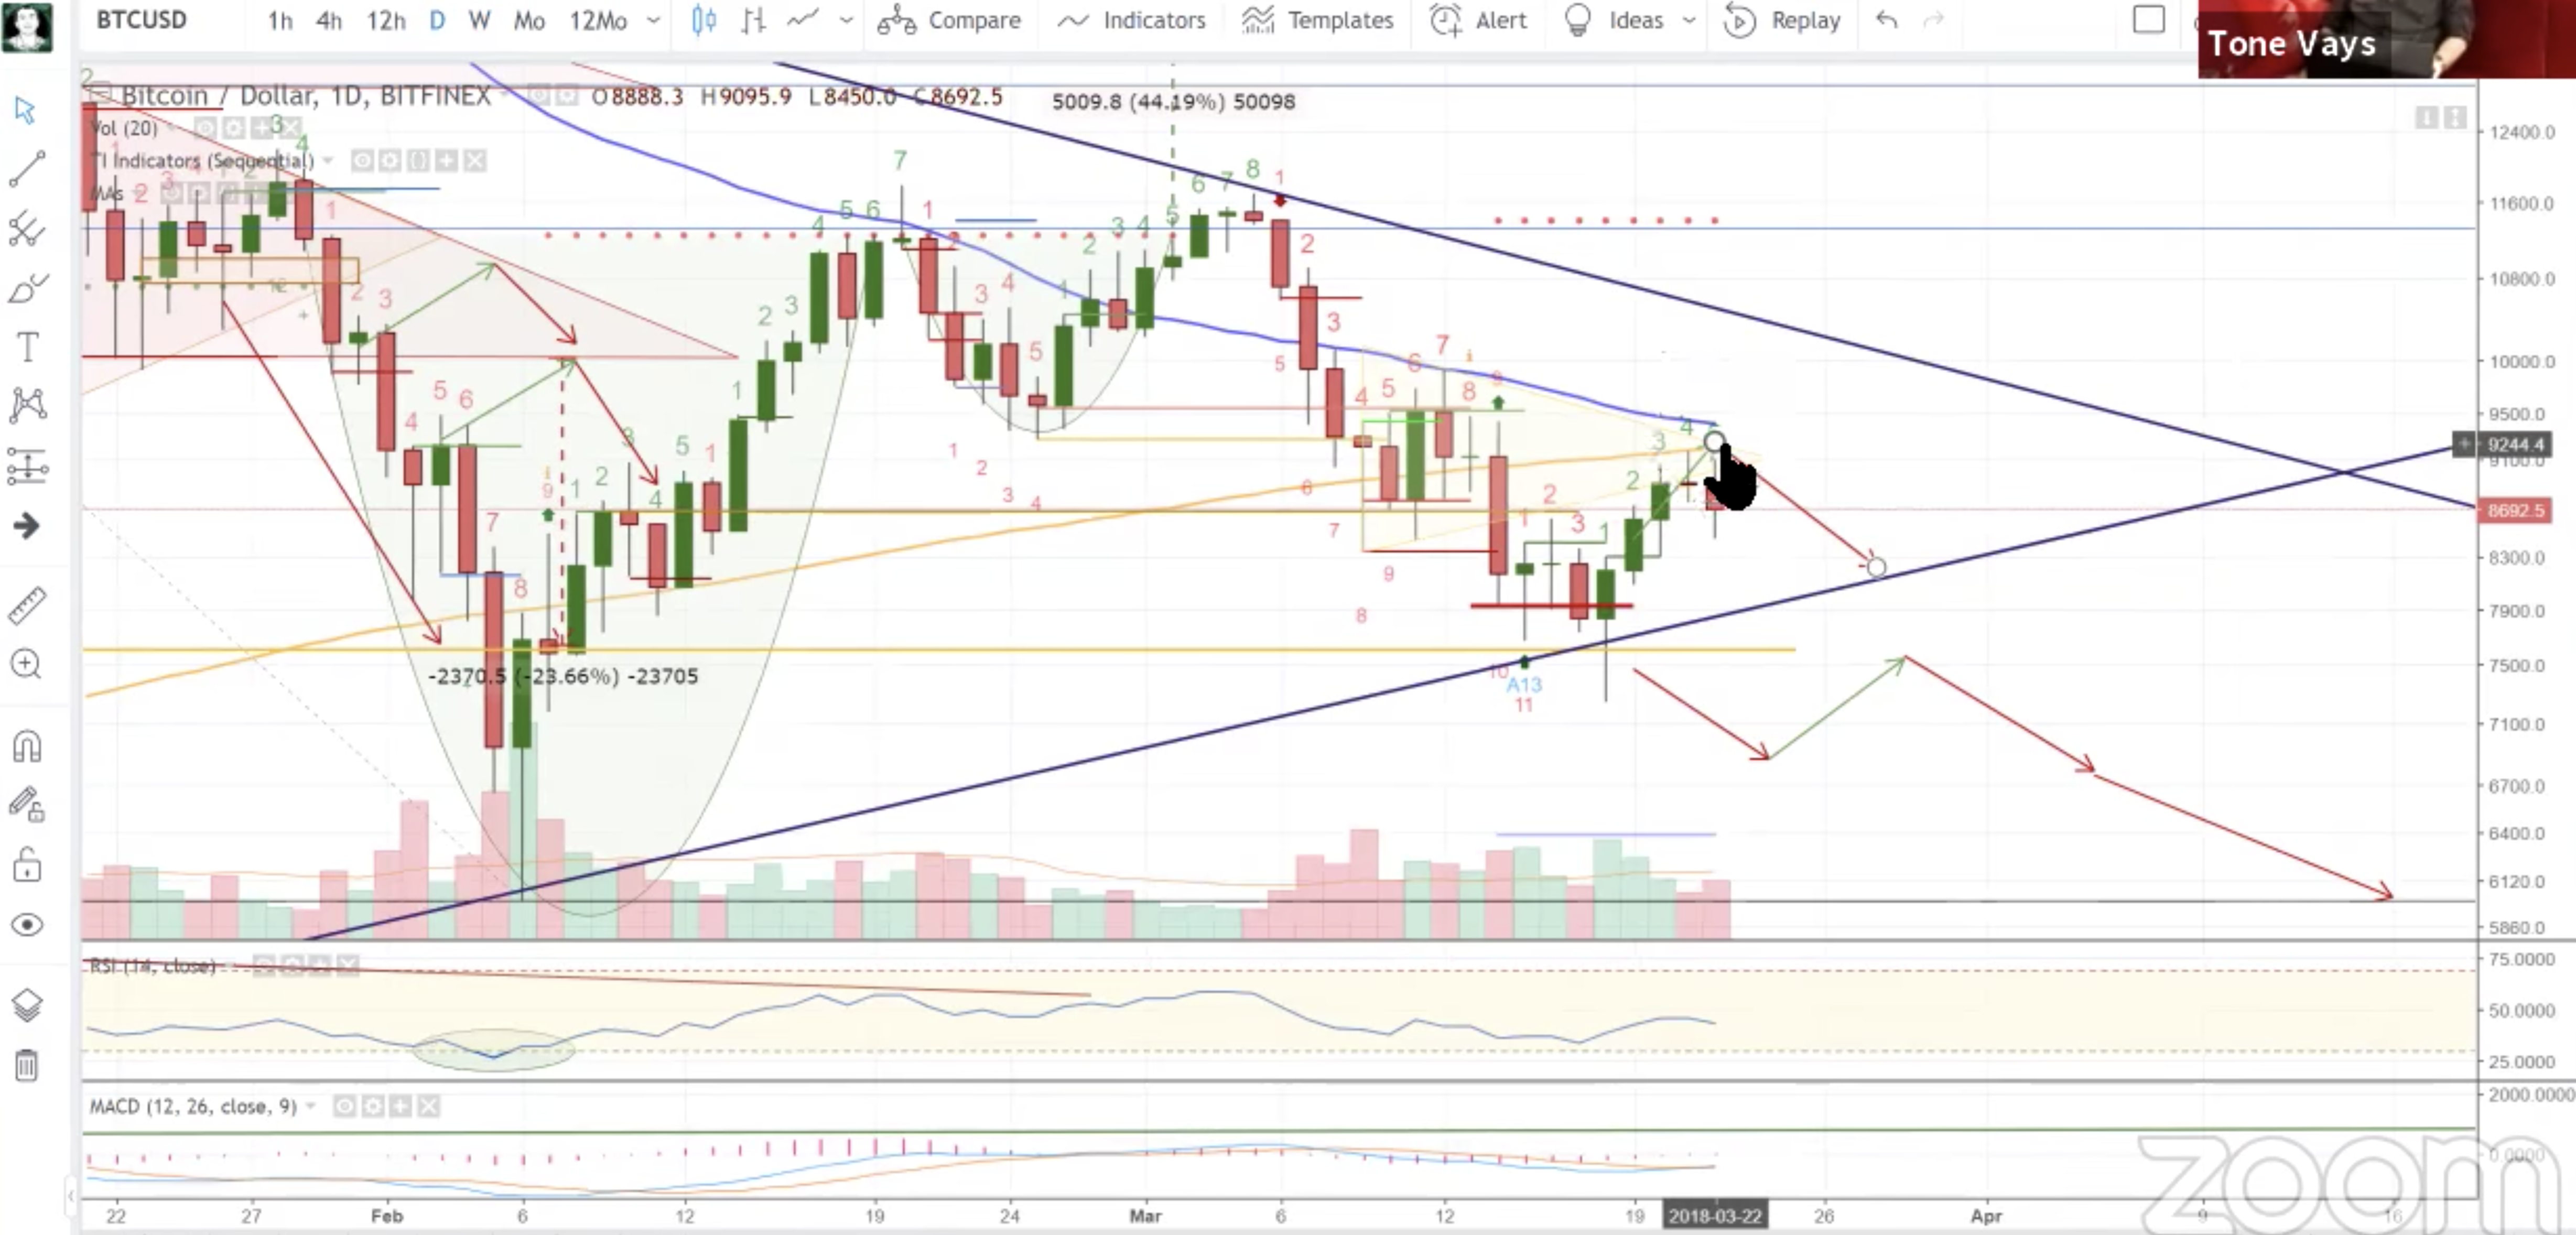
Tone:
- Weekly: Week won't help at the moment. Either it would need to close above 10'000 or below 7'500 to give a signal.
- Daily: We have a pullback as expected. He expect it to go towards the rising uptrend. He still stays more bearish than bullish. So he still sticks to his arrow projections.
- 4hour: give you a 9 soon which could mean a 1-4 reversal to the upside and than down again.

@haejin:
He sees the right shoulder could be still in the works.

Long term he sees us going up to wave D and than down for another wave E.

@ew-and-patterns:

He presents an alternate count for awareness reasons. That one has a target for correction wave C of 4'000.

@lordoftruth:
His bull scenario is still in play and gets only canceled if we drop below 7'200. He expects that the 8'300 support will hold for this correction and that we move back up from here.
Interesting to mention that he sees new all time highs not before 2019.
Todays trend is bullish. Expected trading for today is between 8'199 and 9'260.
@philakonesteemit:
He sees 8'350 being tested. If we fall below that we go to 0.5 - 0.618 fib at 7'983 and 8'212. If 8'350 holds we will test upper channel barrier at 8'600.

@passion-ground:
Move up from the low of 7'325 is stalling at 9'090 in order for the bullish scenario to prevail we need to stay in the uptrend channel (above around 8'256).

Summary of targets/support/resistance


Reference table
| analyst | latest content date | link to content for details |
|---|---|---|
| Tone Vays | 23. Mar | here |
| @haejin | 23. Mar | here |
| @ew-and-patterns | 18. Mar | here |
| @lordoftruth | 23. Mar | here |
| @philakonesteemit | 23. Mar | here |
| @passion-ground | 23 Mar | here |
Definition
- light blue highlighted = all content that changed since last update.
- sentiment = how in general the analysts see the current situation (bearish = lower prices more likely / bullish = higher prices more likely)
- target = the next (short term) price target an analysts mentions. This might be next day or in a few days. It might be that an analyst is bullish but sees a short term pull-back so giving nevertheless a lower (short term) target.
- support/res(istance) = Most significant support or resistances mentioned by the analysts. If those are breached a significant move to the upside or downside is expected.
- bottom = -> now renamed and moved to long term table. Low 2018
- low/top 2018 = what is the low or the top expected for 2018?
Further links for educational purposes:
- From @ToneVays: Learning trading
- From @philakonecrypto: Like in every post you find links to his amazing educational videos. For example here
- From @lordoftruth: Fibonacci Retracement
- From @haejin: Elliott Wave Counting Tutorial
*If you like me to add other analysts or add information please let me know in the comments.
Congratulations for the great work you have been doing for this community! I really appreciate your work and have been recommending your blog to many of my friends. Hey, just a minor thing, I believe the link for Haejin's Elliot Wave Counting Tutorial is not correct. It seems like it is pointing to an analysis update by Haejin instead of his tutorial. Thank you very much for your time!
looks like it's going down, but hopefully it goes up. :)
Is it just my rookie chance that the chart I drew about a week ago has been working pretty well so far?
As I mentioned you before, I'm not expert in ABCDE corrections, but just the other day I learned that these patterns subdivide into 3 subwaves each. So you'd need to have 3-3-3-3-3. I am currently reading this pdf, I highly recommend downloading it to better understand EW rules: https://goo.gl/73yYiu
Seems like 5 waves down is a must! The chart has been precisely in play for over two weeks. No invalidation so far..
Thank you very much for the update about the current scene
-cheers-
Hopefully this will increase
Post The good one
thank you for sharing