Bitcoin TA - summary of analysts - 21. May 18
Regular daily update on BTC ta analysts opinions.

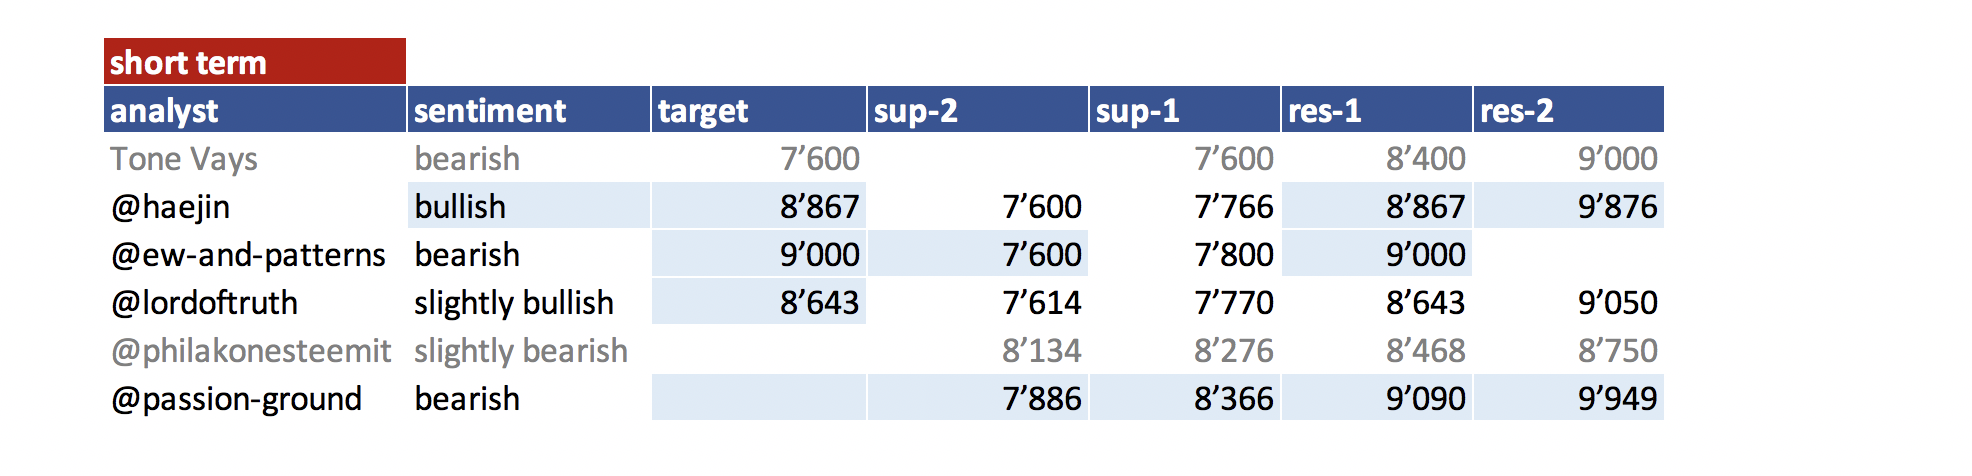
**My summary - short-term sentiment: slightly bearish ** (last: bearish)

We broke over 8'400.
Nevertheless most analysts see this as a corrective wave followed by more downside.
@haejin and @lordoftruth expect us to go up significantly from the swing low of 7'925.
May is usually a strong month. Lets see how it plays out in 2018.

News about the blog
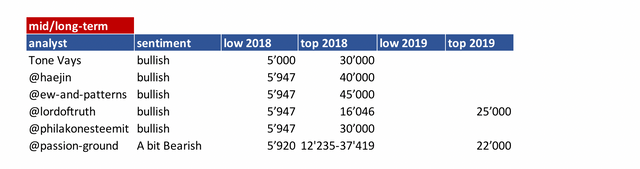
I need to revise my 2018 long term table. I need to add a 2018 and 2019 target an be more precise on the sentiment here. Will do that after I am back in Switzerland.
We lunched the bounty project beta. If you are interested and you like to create a bounty on your own have a look at this post
Analysts key statements:
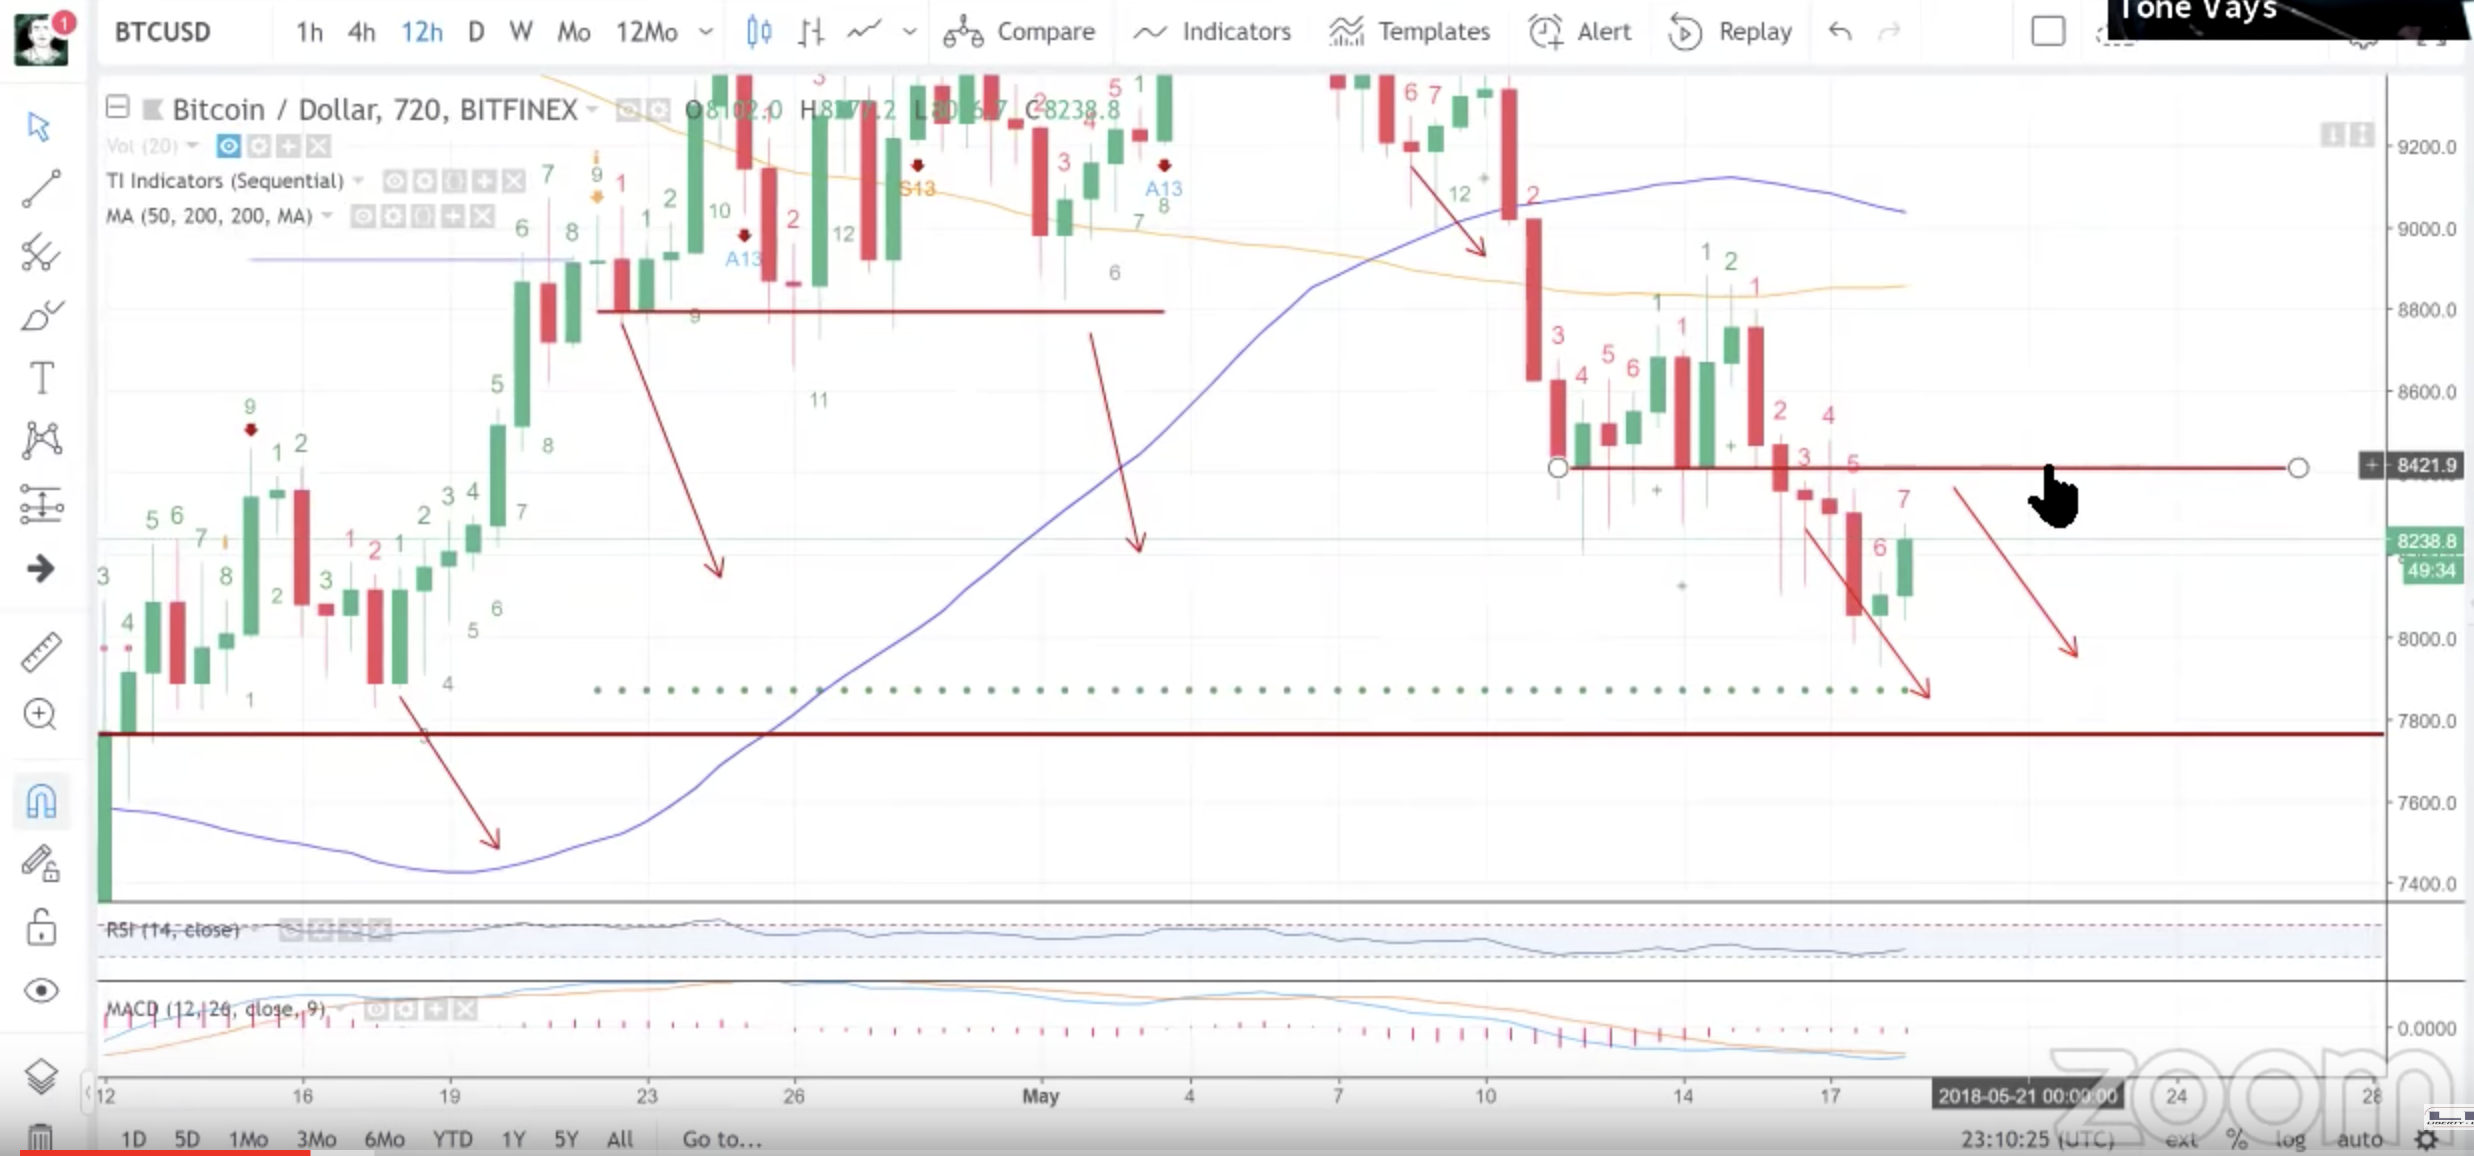
Tone:

- Weekly: Looks very similar to 2014 - we have not been able to get back up over the MA 30.
- Daily: Has a decent day but still below MA 7 and 30.
- 12h: He expects bounce to 8'400 and than accelerating to the downside.
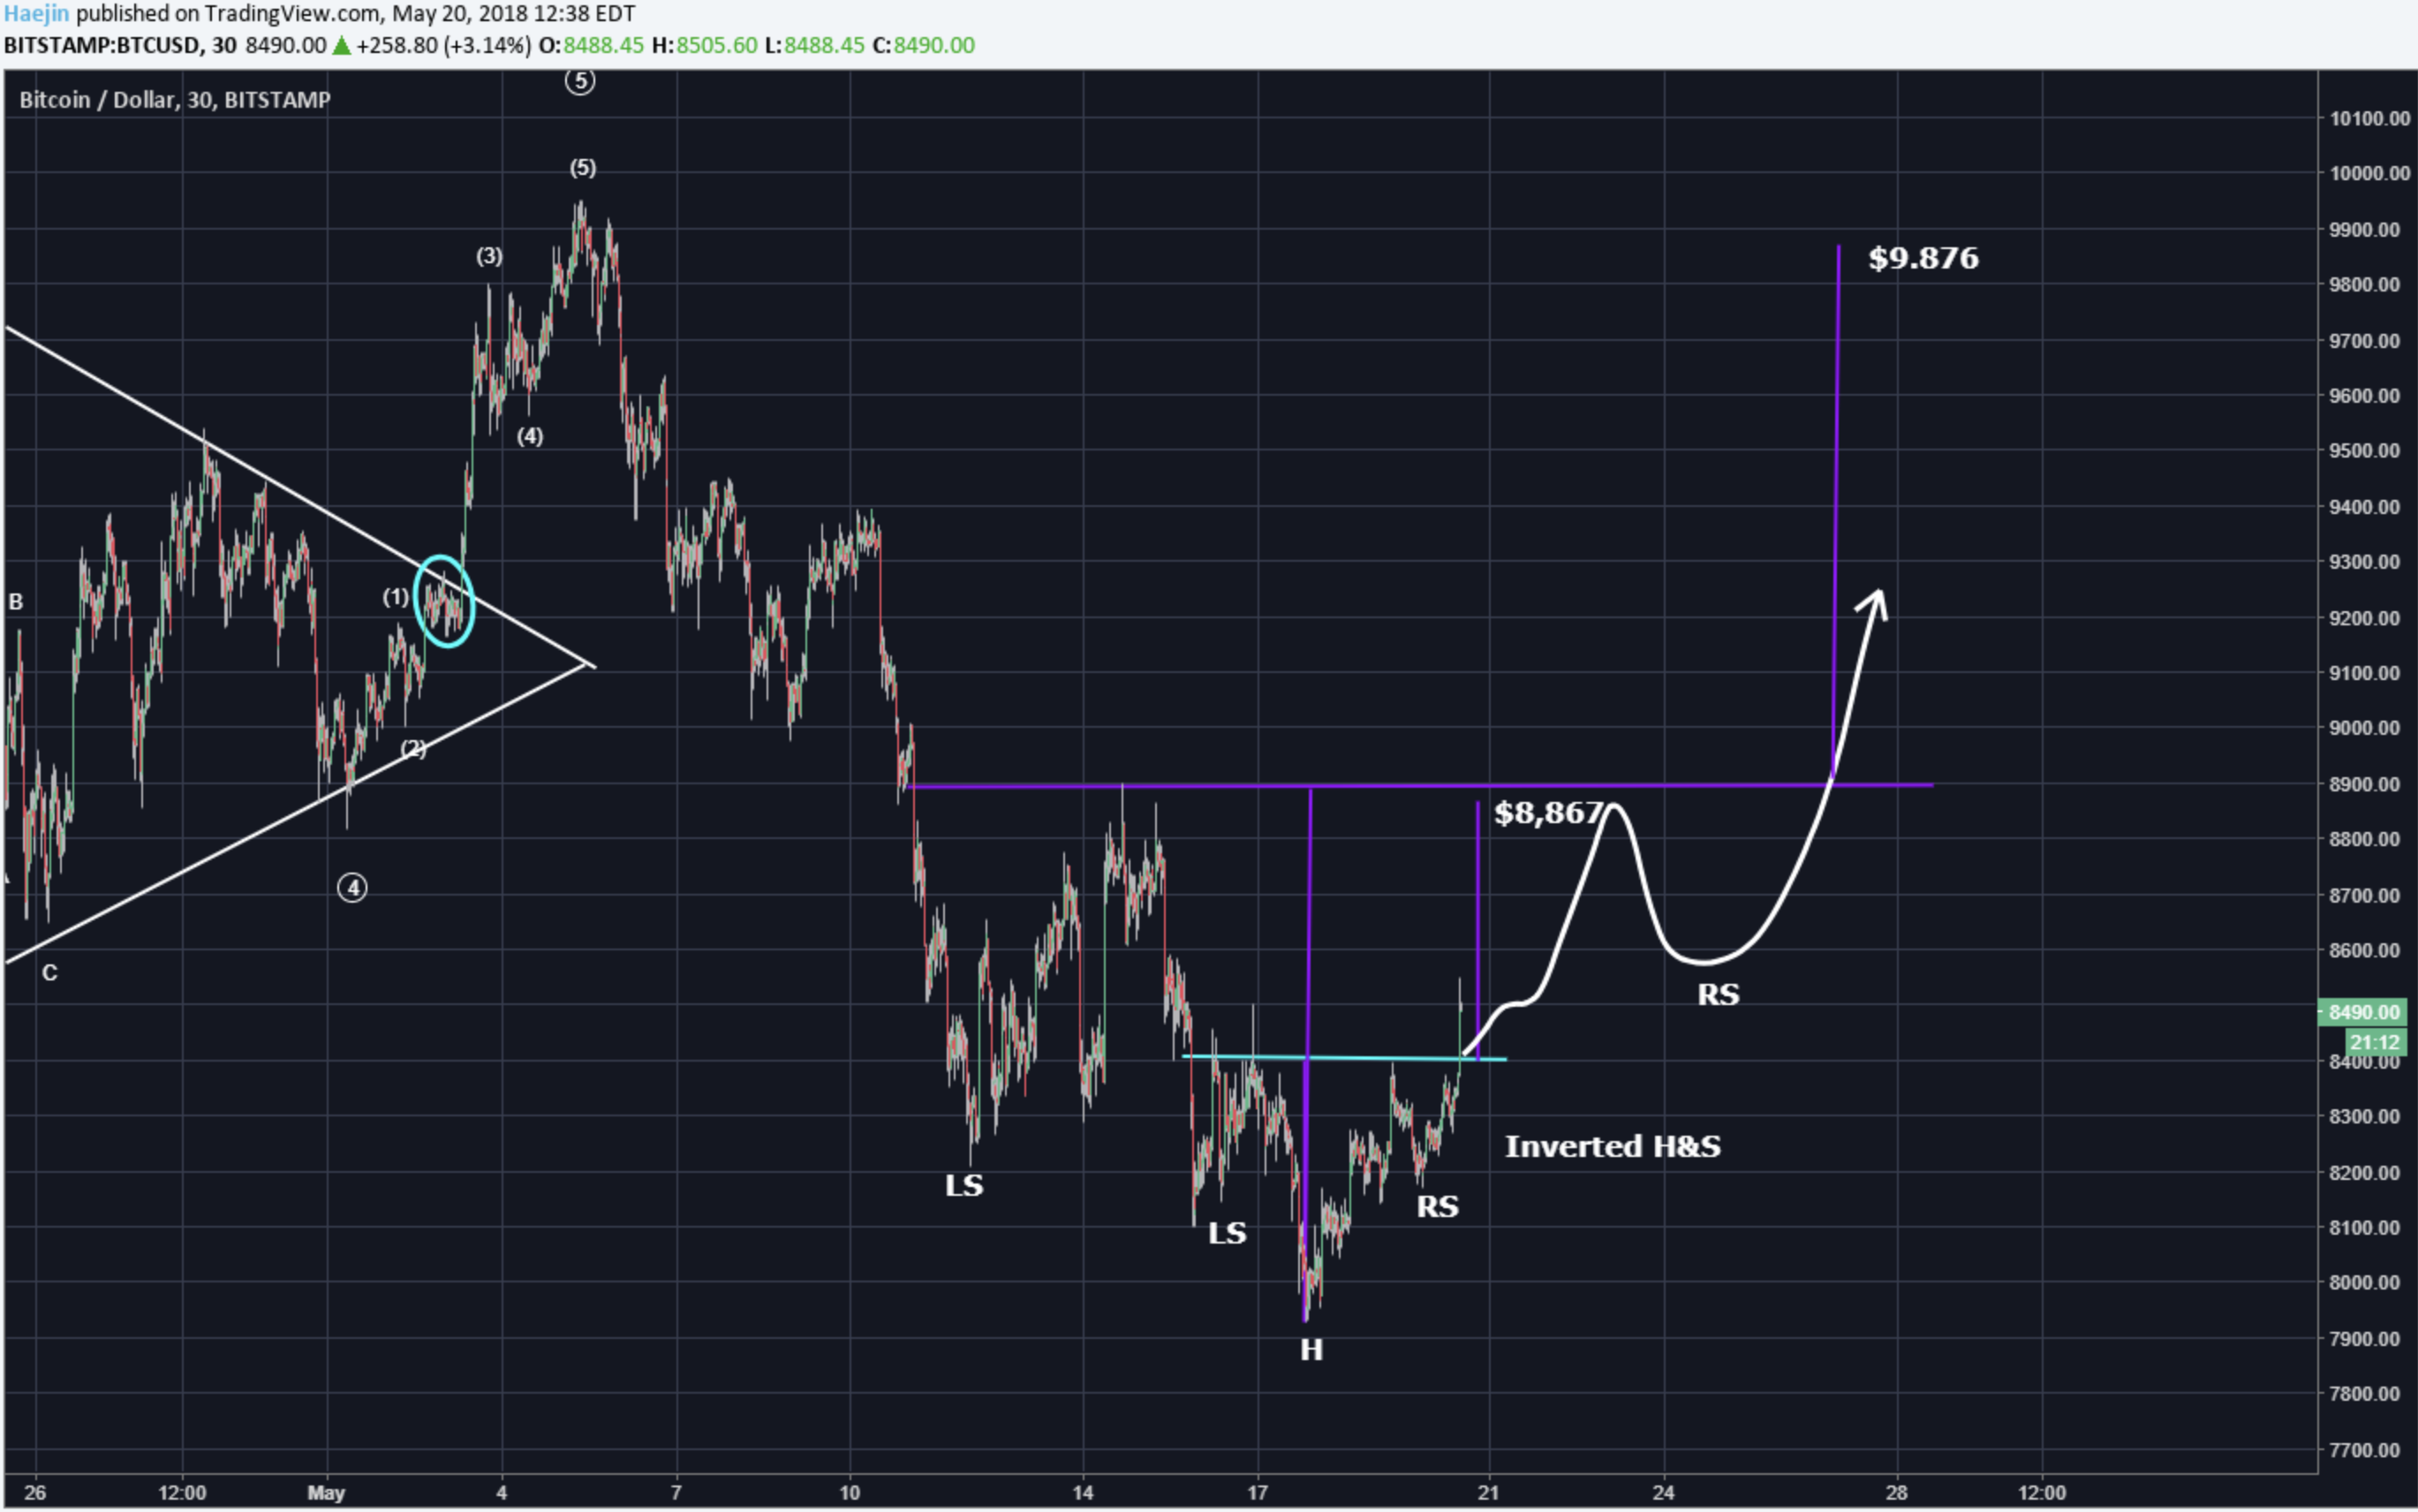
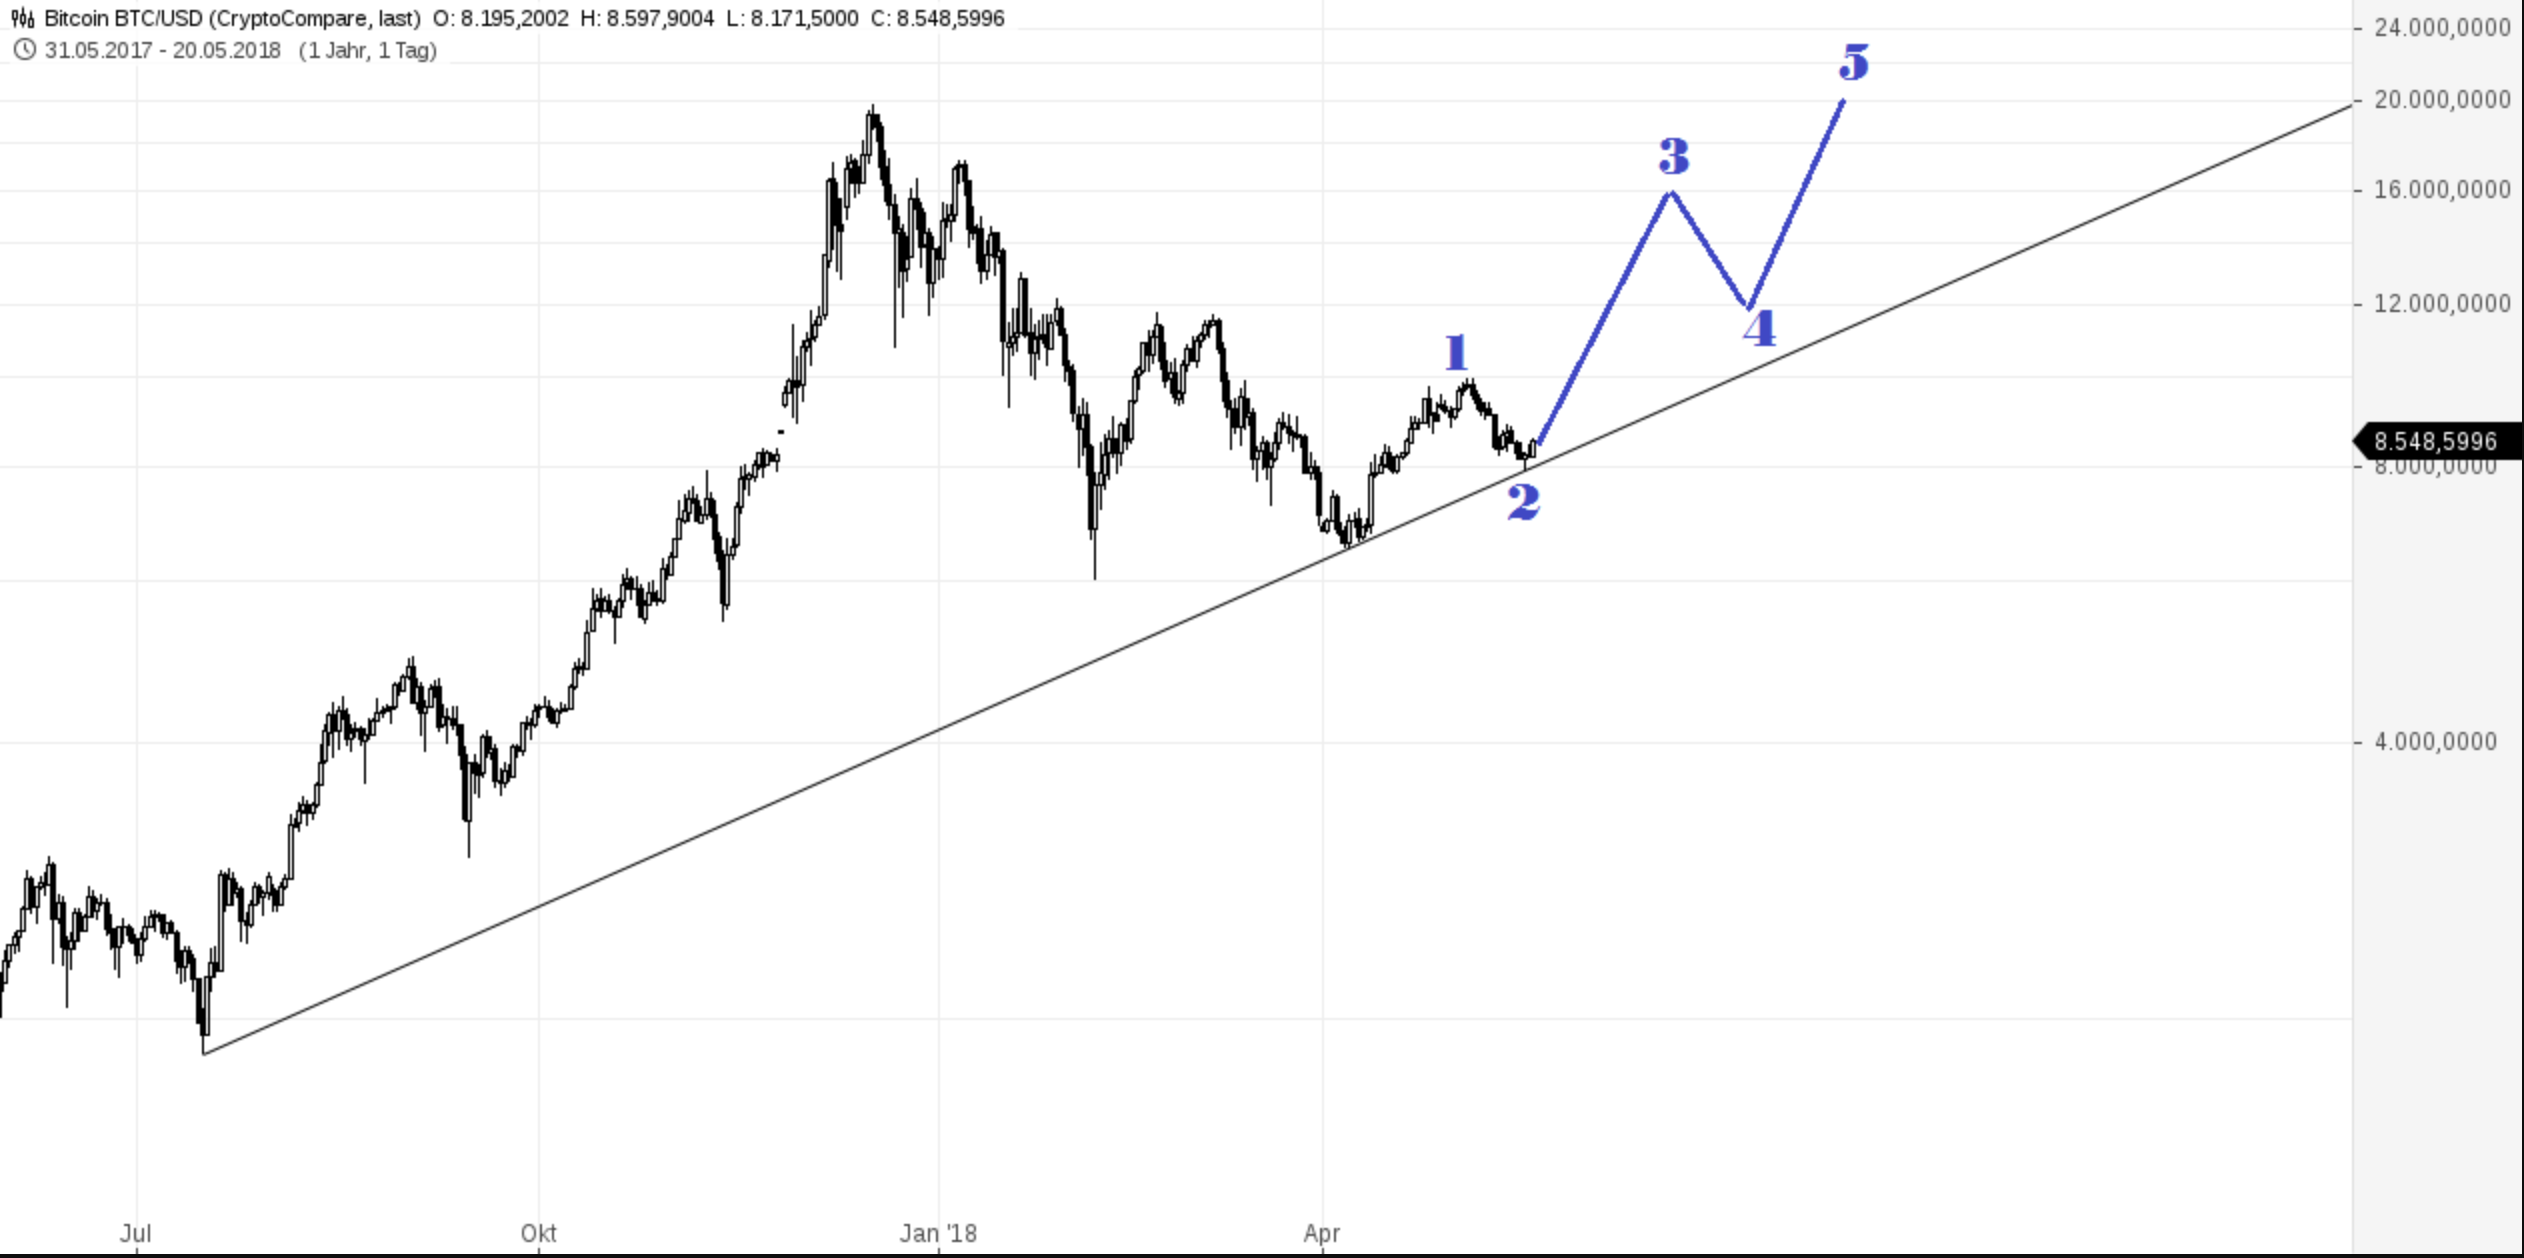
@haejin:
Bitcoin price has initiated what looks like a D wave breakout (blue) arrow. If this is a decisive breakout, then volume should also start increasing (white arrow).
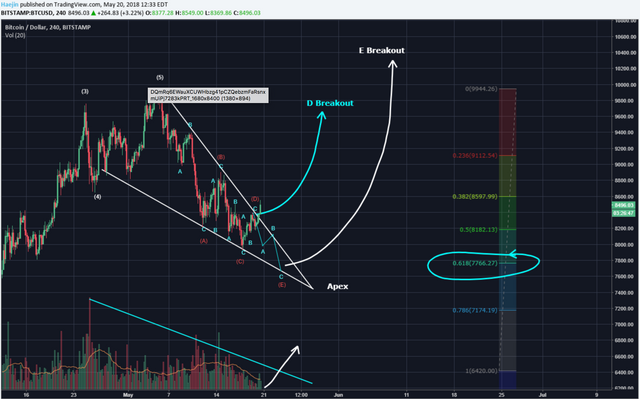
From a forward discernment perspective, the below shows a smaller Inverted H&S which should have a target reach of 8'867. The larger IHS targets the 9'876 and that means that BTC will try and reclaim 10'000 once more.
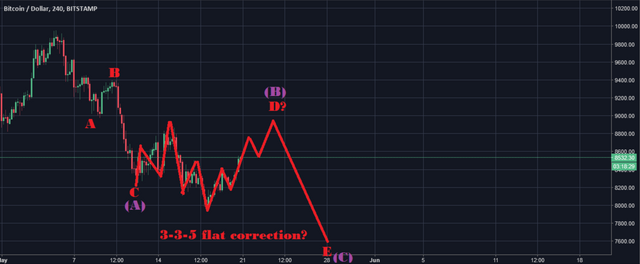
@ew-and-patterns:
This move up looks like a flat correction. He favors the alternate count in brackets (ABC) over the previous ABCDE count. He is seeing three waves down, which means that it can't be the end of the correction.
So if BTC reaches 9000 +-300 and starts crashing hard, see this as confirmation for the ABC count.
Alternate:
The bounce off this trendline could indicate that the correction is over. He still thinks it is not over though.
@lordoftruth:
The Selloff Looks exhausted and he believes the bulls are able to stay in control, to push bitcoin price up to the next station at 8'643 followed by 9'279 ( 0.382 extension ).
Bitcoin price tested 8'643, but technical indicators still suggest Mixed Signals. MACD is stable in the bullish zone, but Stochastic and EMA50 continuous forming for negative pressure on the price.
Todays trend is slightly bullish. Trading between 7'614 and 8'643.
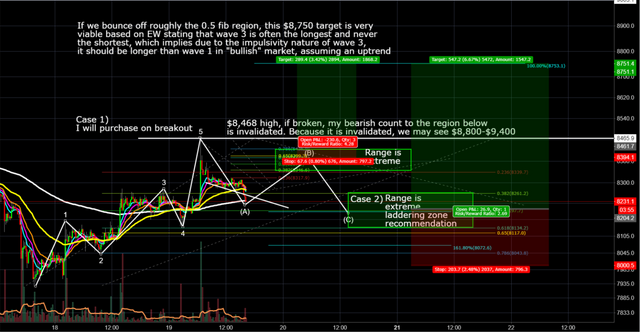
@philakonesteemit:
BTC finishes 5 beautiful waves and has retraced near the 0.382 region thus far.
A break above 8'468 can build a rally to 8'750. A possible B could be in progress very soon, heading up to 8'426 at the 0.786 range before completing C to the indicated range below.
@passion-ground:
The current move up thus far, is clearly corrective… - Unless of course, this modest move higher is a most bullish nested series of 1st and 2nd wave advances. Time will tell, and as such, the utmost in patience and due diligence is required in order to ascertain the true intent and implications of this recent rally off the 7'929 print low.
Summary of targets/support/resistance
Reference table
| analyst | latest content date | link to content for details |
|---|---|---|
| Tone Vays | 18. May | here |
| @haejin | 19. May | here |
| @ew-and-patterns | 18. May | here |
| @lordoftruth | 20. May | here |
| @philakonesteemit | 19. May | here |
| @passion-ground | 17. May | here |
Definition
- light blue highlighted = all content that changed since last update.
- sentiment = how in general the analysts see the current situation (bearish = lower prices more likely / bullish = higher prices more likely)
- target = the next (short term) price target an analysts mentions. This might be next day or in a few days. It might be that an analyst is bullish but sees a short term pull-back so giving nevertheless a lower (short term) target.
- support/res(istance) = Most significant support or resistances mentioned by the analysts. If those are breached a significant move to the upside or downside is expected.
- bottom = -> now renamed and moved to long term table. Low 2018
- low/top 2018 = what is the low or the top expected for 2018?
Further links for educational purposes:
- From @ToneVays: Learning trading
- From @philakonecrypto: Like in every post you find links to his amazing educational videos. For example here
- From @lordoftruth: Fibonacci Retracement
- From @haejin: Elliott Wave Counting Tutorial
*If you like me to add other analysts or add information please let me know in the comments.
This is too good post and we are happy to know that you arr working on daily latest update of bitcoin or other currencies.
Really this is too good work.
This piece is so encompassing. From a newbies standpoint it has given me the direction and projections to make. Thank you @famunger for sharing such educative post.
Yes its a like full information you share here its a informatic stuff guide us with better way and the way you sharing post its simply outstanding mindblowing keep it for in future too for steemians
I am confused now!, someone say it will go down, someone say it will go up
but in my personal oppinion, Bitcoin is likeley to go down first.