Bitcoin TA - summary of analysts - 18. Apr 18
Regular daily update on BTC ta analysts opinions.

My summary - short-term sentiment: bullish (last: bullish)

Great - we got an update from every analyst today. That was a long time ago we I had so much view and outlooks to provide to you.
General comment is still valid - current price action is going up though.
A short term correction is expected to the level of 7'500 - after that continuation of the bullish uptrend.
The bulls see the downtrend to be over and the 6'500 level as swing low.
Tone still remains bearish. Scaling out on weekly he sees no sign of turning bullish (yet). The similarity to 2014 is overwhelming in his point of view - the move upward might be the 2014 bull trap which destroyed the bulls for month.
April is used to be a good month for crypto. Lets see how this turns out this time.


News about the blog
I need to revise my 2018 long term table. I need to add a 2018 and 2019 target an be more precise on the sentiment here. Will do that after I am back in Switzerland.
We lunched the bounty project beta. If you are interested and you like to create a bounty on your own have a look at this post
Analysts key statements:
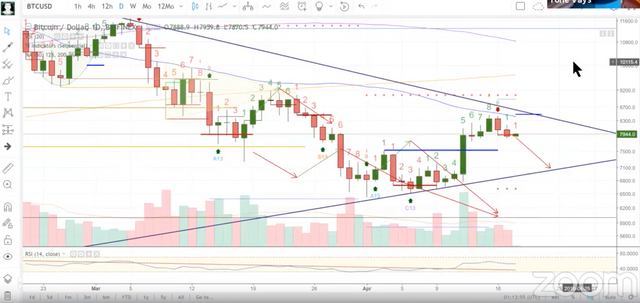
Tone:
- Weekly: We got rejected by downtrend. Count to 9 got interrupted which is at best a neutral but probably bearish.
- Daily: We got a 9 daily. It may give a shorting opportunity. Stop loss right above 50 MA. He is convinced that we are done with the upmove and go down. Target 7'200.

@haejin:
Bitcoin is tracking a fractal seen below. This would lead to a bullish move further up.

His alternate count is that A and B are completed and wave C of the correction is to come net.

@ew-and-patterns:
Has an update of his count - with this new one current drop blends in perfectly.

@lordoftruth:
He sees Intra-day fluctuation holds a high degree of manipulation.
Head and Shoulders Pattern with 8'180 as neckline has just completed.
BTC tests EMA50. After correction most likely the current uptrend could carry on.
Todays trend is slightly bullish. Expected trading for today is between 7'550 and 8'640.
@philakonesteemit:
BTC bearish patterns are still in play and we are on pace to hit 7'400 - 7'615.

@passion-ground:
BTC has breached horizontal range to the downside turning his short term bias bearish with price target 7'423. Thereafter he would like to see strong bullish move.

Summary of targets/support/resistance


Reference table
| analyst | latest content date | link to content for details |
|---|---|---|
| Tone Vays | 18. Apr | here |
| @haejin | 18. Apr | here |
| @ew-and-patterns | 17. Apr | here |
| @lordoftruth | 18. Apr | here |
| @philakonesteemit | 18. Apr | here |
| @passion-ground | 18. Apr | here |
Definition
- light blue highlighted = all content that changed since last update.
- sentiment = how in general the analysts see the current situation (bearish = lower prices more likely / bullish = higher prices more likely)
- target = the next (short term) price target an analysts mentions. This might be next day or in a few days. It might be that an analyst is bullish but sees a short term pull-back so giving nevertheless a lower (short term) target.
- support/res(istance) = Most significant support or resistances mentioned by the analysts. If those are breached a significant move to the upside or downside is expected.
- bottom = -> now renamed and moved to long term table. Low 2018
- low/top 2018 = what is the low or the top expected for 2018?
Further links for educational purposes:
- From @ToneVays: Learning trading
- From @philakonecrypto: Like in every post you find links to his amazing educational videos. For example here
- From @lordoftruth: Fibonacci Retracement
- From @haejin: Elliott Wave Counting Tutorial
*If you like me to add other analysts or add information please let me know in the comments.
So many other great analysts on this platform. Such a shame not to include them.
Great analysts @famunger
Thanks for another analiest related post...... Upvote done
maybe like this, i feel bitcoin a bullish trend was come right now, triangle break up, and move $20000 so potential for me
The trendline needs to be successfully retested as a support, otherwise we may find ourselves in yet another bulltrap scenario.
Yer, i agree, more supports need to show before confirming a bull trend. Market is still uncertain, it is so easy to be manipulate by the billionaires currently... they can pretty much control it to go up or down. Unless market is strong in bullish, otherwise... any trends are still weak and can be manipulated.
i think maybe this is potential for new trend, because wave done in daily. hope so this is correct :D
Thanks for great post..i appreciate this cryptocurrency..
Thanks again for the summary. A small point: looks to me like your image of Haejin’s alternate is just a repeat of the first image. Replace with alternate?
it's too easy to say that they are bullish in the long run without giving a date!! i can say the same, everybody who's still in crypto would say the same! come on! the only reason we are watching the charts is to get the short term.
and they aren't clear enough :(
well I'm bullish in the short term until 8600 then I have no clue :D