Bitcoin Double Top Formation ? Double Top Explained [06.03.18]
I know it might be a bit early and the time frame is relatively short but I can't help it and point out that a double top pattern formation is shaping up !
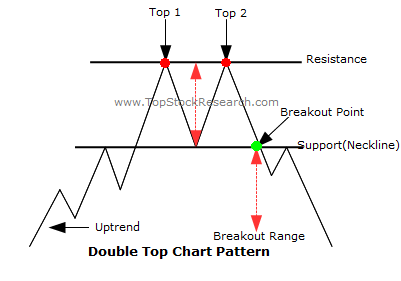
Double Top Chart Pattern
- A double top forms when the price makes a high within an uptrend, and then pulls back
- It's called a double top because the price peaked in the same area twice, unable to move above that resistance area.

You can see from Chart 1 in order to have a double top we need to have an uptrend, two tops (which effectively are the current resistance) and we also need a neckline (The new support)
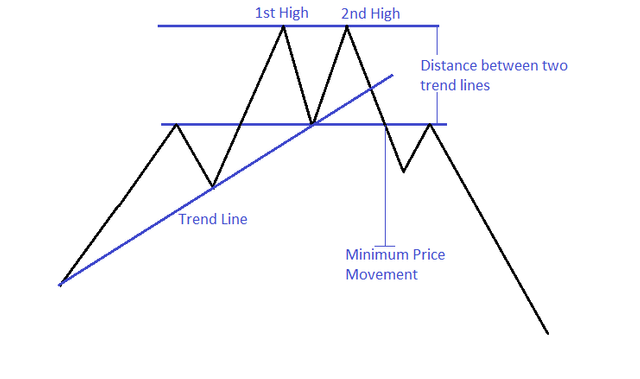
Here you can see more clearly what is needed for a double top. Now look what we have on the Bitcoin chart !
It looks pretty similard to me. Obviously the double top pattern is not confirmed yet and it is quite early to speak of it. For it to be confirmed we need to break the neckline (support) at ~9500$ and around 8600$ it will be validated. However this is very interesting to watch and gives you additional perspective.
If we look at the whole picture we are still looking good for some bullish movement - we are above all major moving averages and this might be a little pullback, so BTC can regain some energy to finally break this 12k level. I personally have a very small position on ETH juts to back my own words with some $. What good is my analysis if I can't back it up :) Overall I wait for more signals from the market, right now it looks very choppy.
What do you think ? How do you see this pullback - as a bullish or bearish indicator ? Share with us in the comments :)

It's a pretty clear setup alright, and with BTC transactions hitting two year lows as fees rapidly drop, it could well break lower.
https://blockchain.info/charts/n-transactions
Thank you for your input ! This is what I like about Steemit, there are plenty of points of view and everyone has their own understanding of the charts. Most of the TA's, who use mainly Eliott Waves and they seem to be the most respected and well compensated TA's believed that everything will work like a charm and we will hit new highs ( which is also my long - term view) but I also try do to my own analysis.
Because if I win or lose money I prefer to lose it on my own idea. Also my analysis is usually very simple - Moving averages and simple patterns. Also the latest development of the events has confirmed that we are indeed in a bear market, because the market igonored all the positive news and react immediately at the negative ones, which is a major indicator for a bear market :)
Thank you for your comment :)
thank you for sharing the formation!
my view bitcoin above the long term resistance line, although it tapped the stronger level and dipped.
Trend lines are magic man! RSI breaking below its support line, Waves seen to be flipping down. Going to test the 50 day $10,695 and then 20 day at $10,500 also short term support line.
It tested them alright, now we are at the lows from few weeks ago. 9500 $
15 hours after your writing double top patters completed. Nice post! catch it a little late.
Thank you ! To be honest I didn't expect to happen that fast, but I guess people are somewhat concerned over something. Hope you are making good money :P
I can't tread short on BitShares I'm idle. Actually I ladder in using margins but BitShares have no mechanism to correctly settle short trade, so I have to wait to price come up again and I end up with bunch of extra BTS in my pocket.
Now I am in the middle of the process exploiting this sharp dip Bitcoin made. BTS is high correlated in price moves, so there is a spike in BTS too.
Oh, I see. What do you mean by "I ladder" You are bulding a long position ?
It's hedging long position in correction periods of overall uptrend, yeah!
I borrow bitUSD from blockchain for some collateral in BTS on lower heights and when price drops i buy back BTS at a lower price and maintain collateral of borrowed bitUSD. I always calculate how much bitUSD I have to have to cover the worst scenario. This is 100% loss measuring from the beginning of last uptrend impulse wave, which is very unlikely.
This way I increase position in BTS in correction phase and profiting back in impulse uptrend phase.
At the end of uptrend when I want to exit this trade, I reduce collateral in BTS to minimum, wait that margin call is executed and then sell reminding BTS.
It's a bit complicated (some tutorial will be great to write), but is the only way on BitShares DEX to profit something in downtrend movements. (effectively a complicated way of shorting)
I guess a BitShares Tutorial Series might be very beneficial for the community and you can earn yourself some good rewards :) I think you should do it as a lot of people here use BTS
Definitively must find some time to do it!
You got a 1.97% upvote from @buildawhale courtesy of @ervinneb!
If you believe this post is spam or abuse, please report it to our Discord #abuse channel.
If you want to support our Curation Digest or our Spam & Abuse prevention efforts, please vote @themarkymark as witness.