Bitcoin (BTC) Price Update: Is this the Breakout We're All Waiting For?
Hi guys!
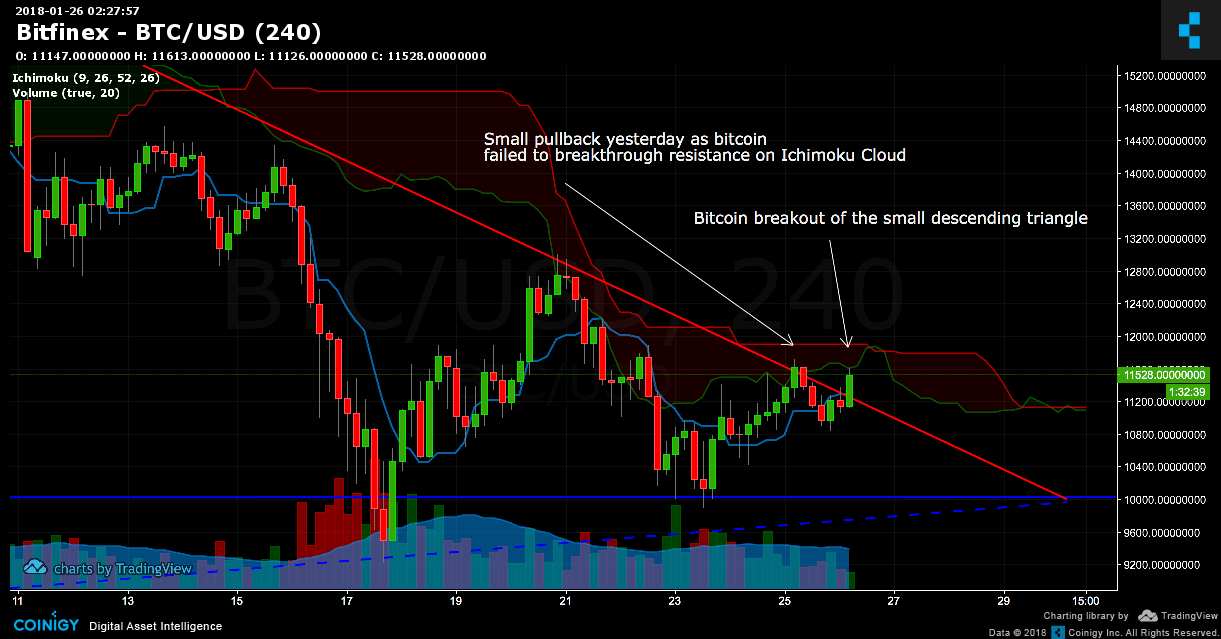
It seems like bitcoin is breaking out of the descending triangle with nice and steady volume.
BTC - 4 Hour Chart
Tools used: Volume, Ichimoku Cloud and Trendlines

On the 4 hour time frame we can see a small pullback yesterday as bitcoin price was around $11,700. Honestly, I'm still amazed by how the cloud could predict the price action on this time frame.
As you can see on the chart if the volume is steady for the next 12 hours or so. We should see bitcoin breaking through the resistance on the Ichimoku cloud (around $11,800 price area).
I would look for price around $12,000 for a confirmation of a breakout from this descending triangle. Now remember the candle has to close on that price before we could consider this a confirmation.
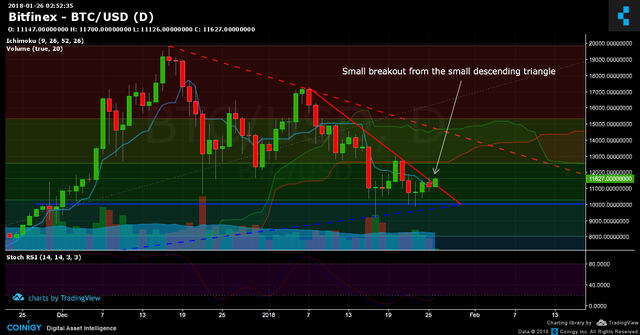
BTC - Daily Chart
Tools used: Fib Retracement, Stoch RSI, Volume and Ichimoku Cloud

On the overall trend you can see stoch RSI is building a bullish momentum. And as for resistance price level you can check my previous post.
Disclaimer
You know the drill guys. This is just opinion and not a financial advise. Do you own research and decide your own trades. Cheers!
Finally! Some good news in the BTC price analysis. Thanks for the post!
I was waiting for the breakout as well!