Bitcoin (BTC) Price Update: Breakout Happening?
Hi guys!
Here are my TAs for bitcoin price today.
BTC - 4 Hour Chart
Tools used: Ichimoku Cloud, Trendlines and Stochastic RSI

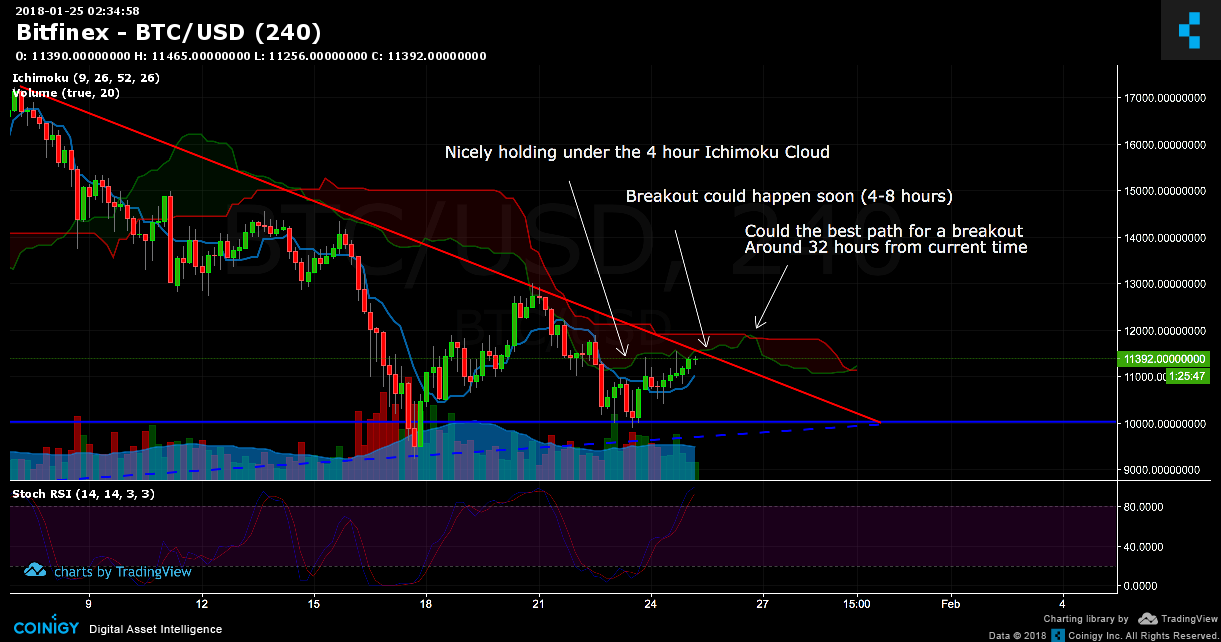
Honestly, I'm surprise by the price action for the past 24 hours. If you look at the chart its following the shape of the cloud on the 4 hour time frame. Even the wicks are just touching the resistance on the cloud and had small pullbacks.
As you can see on the chart there, bitcoin could breakout of this small descending triangle in the next 4 to 8 hours from this chart is posted.
However, stoch RSI is showing that bitcoin is overbought so there is a possibility that a pullback could happen. We'll take this into consideration with the overall trend on the daily chart down bellow.
BTC - 12 Hour Chart
Tools used: Fib Retracement, Ichimoku Cloud, Trendlines and Stochastic RSI

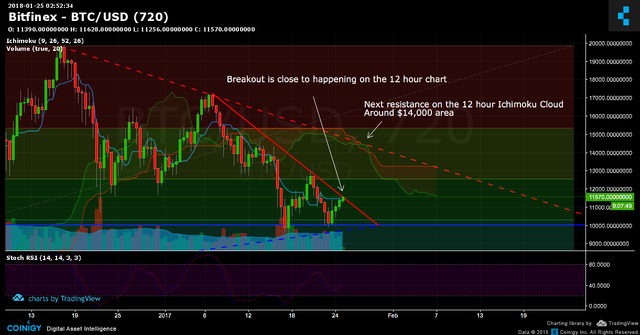
On this time frame, breakout is happening right at this hour. So, this will be make or brake moment. If it breaks, the support line will be $10,000. If it breaks out next resistance would be $14,000 area on both ichimoku cloud and descending triangle.
Note: stoch RSI on this time frame is showing bullish signs compared to ones on the 4 hour chart.
BTC - Daily Chart
Tools used: Fib Retracement, Ichimoku Cloud, Trendlines and Stochastic RSI

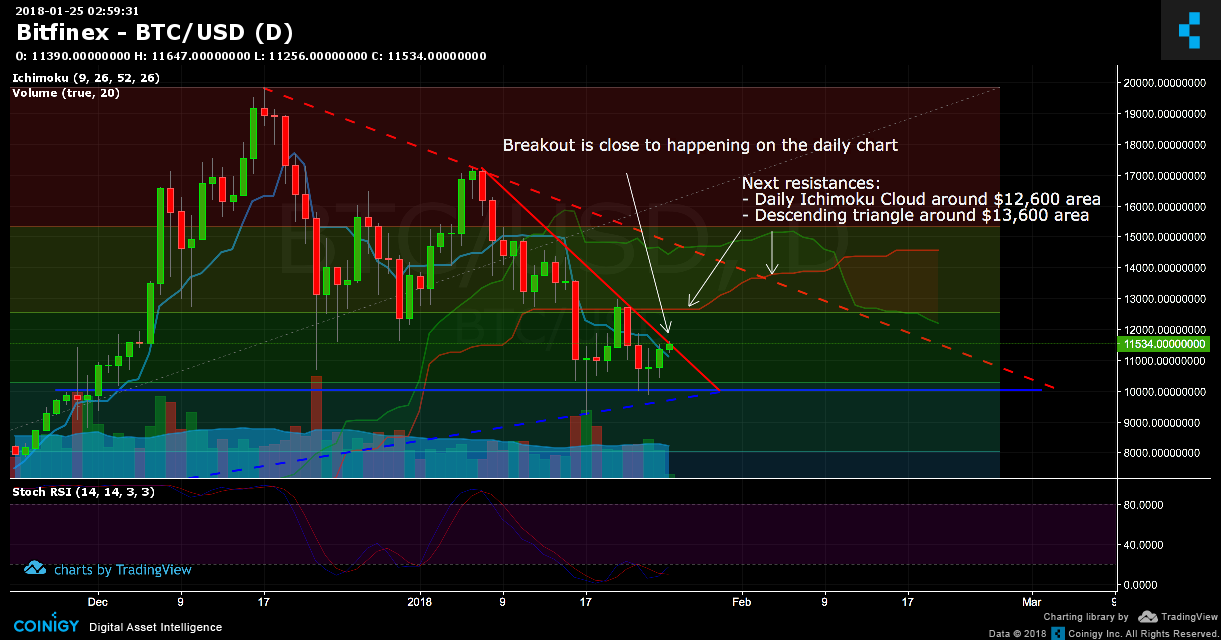
I think the best time frame is always the daily chart so we can see the overall trend. So, the breakout is obviously consistent through the different time frames (4 hour, 12 hour and daily).
Next, the stoch RSI on the daily chart is showing sign of bullishness (just like the 12 hour stoch RSI). And, as for next next major resistance $14,000 seems to be price to lookout for.
Conclusion
From all these signs, I think with steady volume we could breakout from the small descending triangle ($11,500 price area).
However, since there are 2 major resistance on the daily chart we might have to wait for another month for a stronger confirmation (the massive descending triangle crosses over around early March).
Then again this is not a market prediction, I am just looking for signs and prices to lookout for. So, I could adjust my strategies on my trades. Since, I've got my eyes on some alt coins that could be a great addition to my portfolio but have to wait for confirmation on bitcoin trend.
Disclaimer
You know the drill guys. This is just opinion and not a financial advise. Do you own research and decide your own trades. Cheers!