Daily Bitcoin/BTC Price Review (14 Mar 18)
This is not Financial advice: Do not trade or invest based on this analysis.
Price
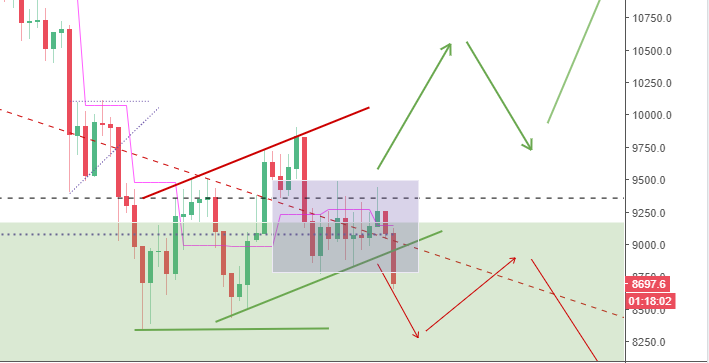
Following on from yesterday's review (here) the BTC price has been struggling in a range between ~$8,700 and &9,500 at the top of the support zone (green area).
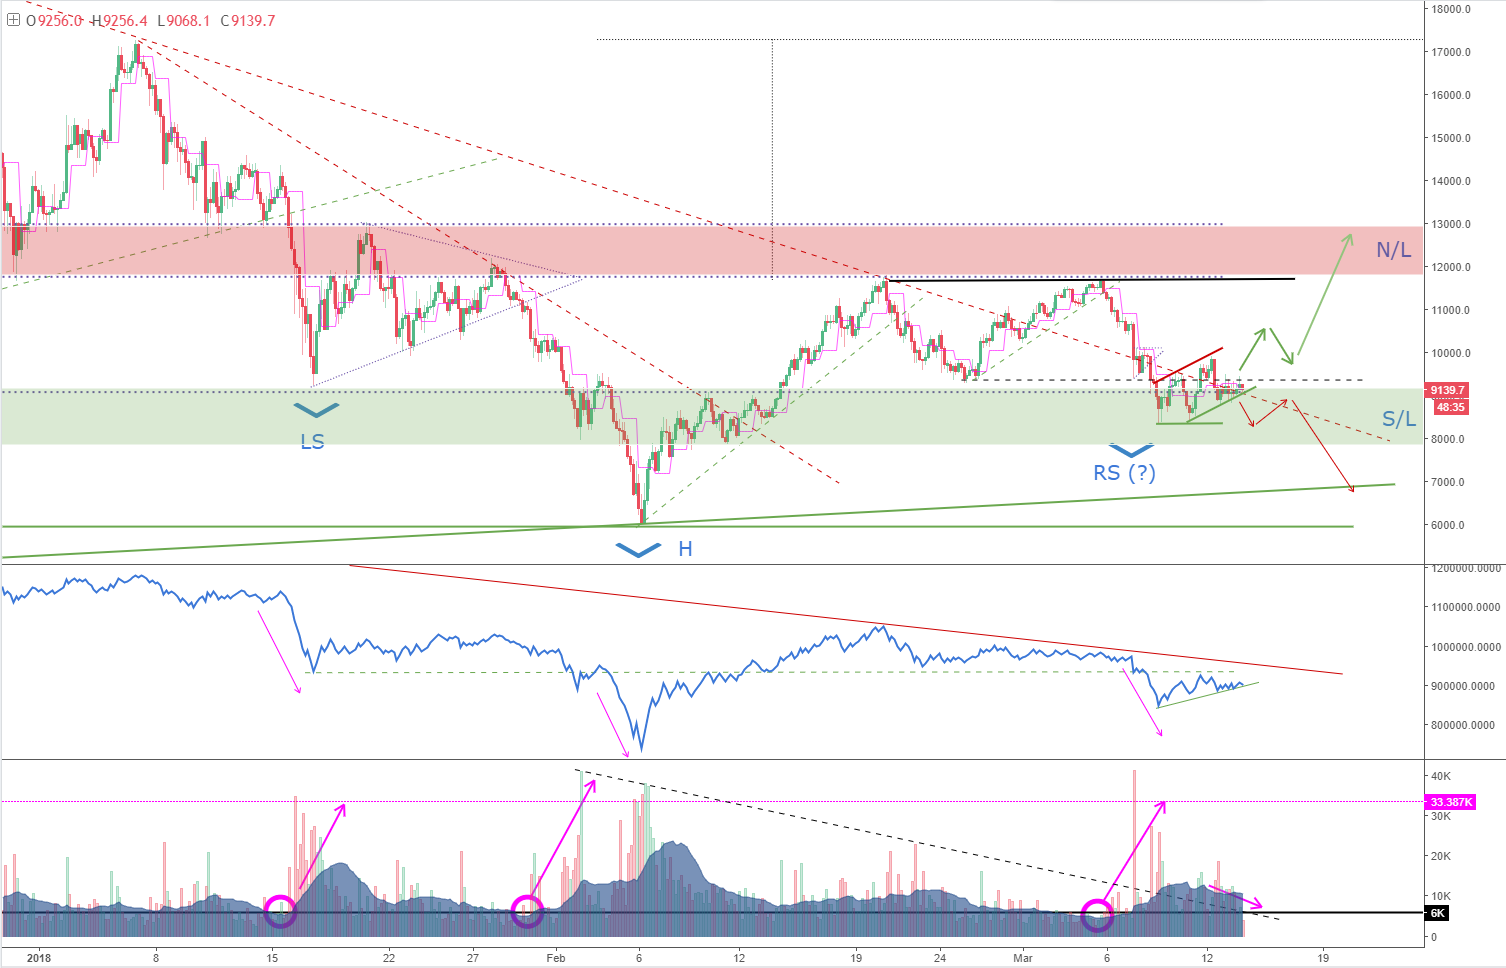
The price had been forming an ascending channel, but is now 'crawling' along the bottom of it within the aforementioned range (purple box).
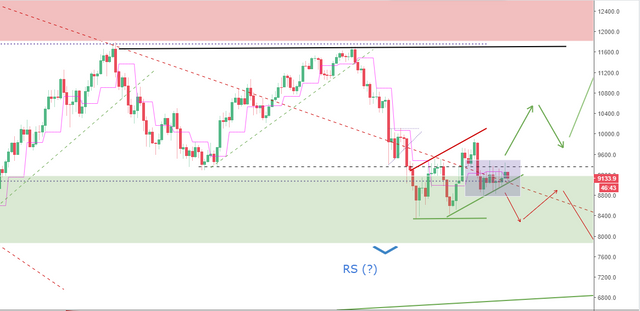
In traditional technical analysis (say on Forex), this is a bearish sign, indicating some downward price pressure. Therefore I wouldn't be surprised if the price breaks the support of the nascent ascending trading channel and retests the support at $8,300.
Key Levels to Watch
Resistance
$9,500 - first resistance level (top of the current crawling trading range)
$10,000 - second resistance level (most recent significant high)
Support
$8,800 - first support level (bottom of the current crawling trading range)
$8,300 - second support level (most recently held support)
Volume
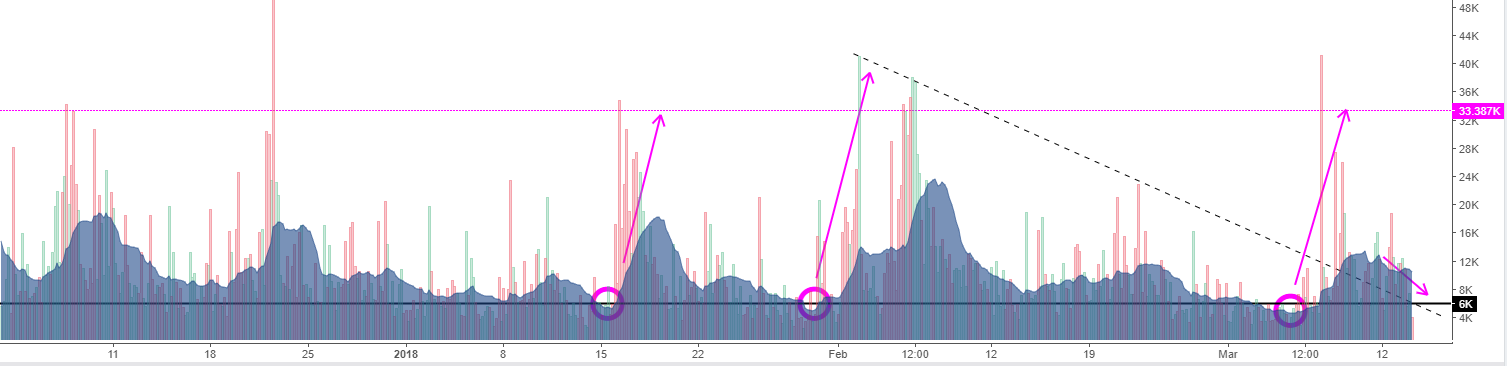
The trading volume is looking fairly consistent and is flattening out, which for the moment should prevent dramatic price swings:
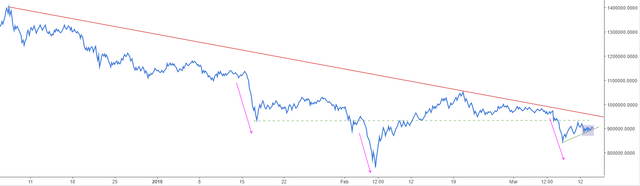
The On-Balance Volume Indicator is mirroring the current crawling price action, still holding the relatively shallow ascending trendline, favouring buyer strength, but only just.
Bias
I still favour an upward price move to the resistance zone (starting at ~$12,000), however, to me it looks like the price is weakening in the short term (due to the crawl) and may break the recent rising trendline and head and south to the previous support at $8,300.
If it does, I'll be looking for a spike-and-bounce and rapid recovery. If the price doesn't recovery relatively quickly, I think my Bear will be making an appearance after a few weeks in hibernation.
But it could all change tomorrow.
Until then,
Bobby.
As an update, the price did break down through the bottom of the channel as suggested in the post. Keep an eye on the $8,300 level, if this doesn't hodl there could be further down side to come.
 .
.