Bitcoin/BTC Daily Price Review (13 Mar 18)
This is not Financial advice: Do not trade or invest based on this analysis.
Price
Following on from yesterday's review (here), the BTC price popped its head out of the support zone (green area) but then dove back in.
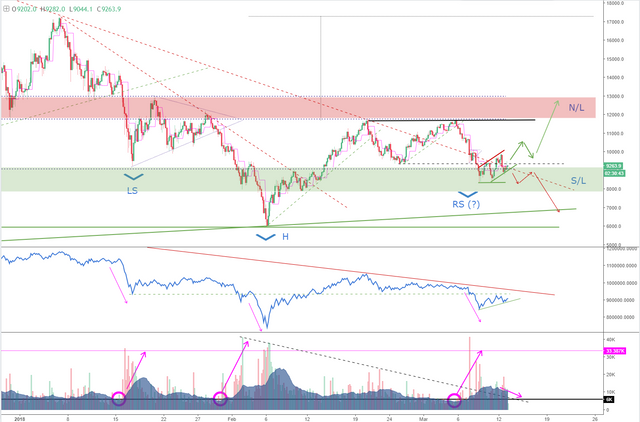
The level around approximately $9,500 appears to be a 'sticky' area and there is general market indecision here.
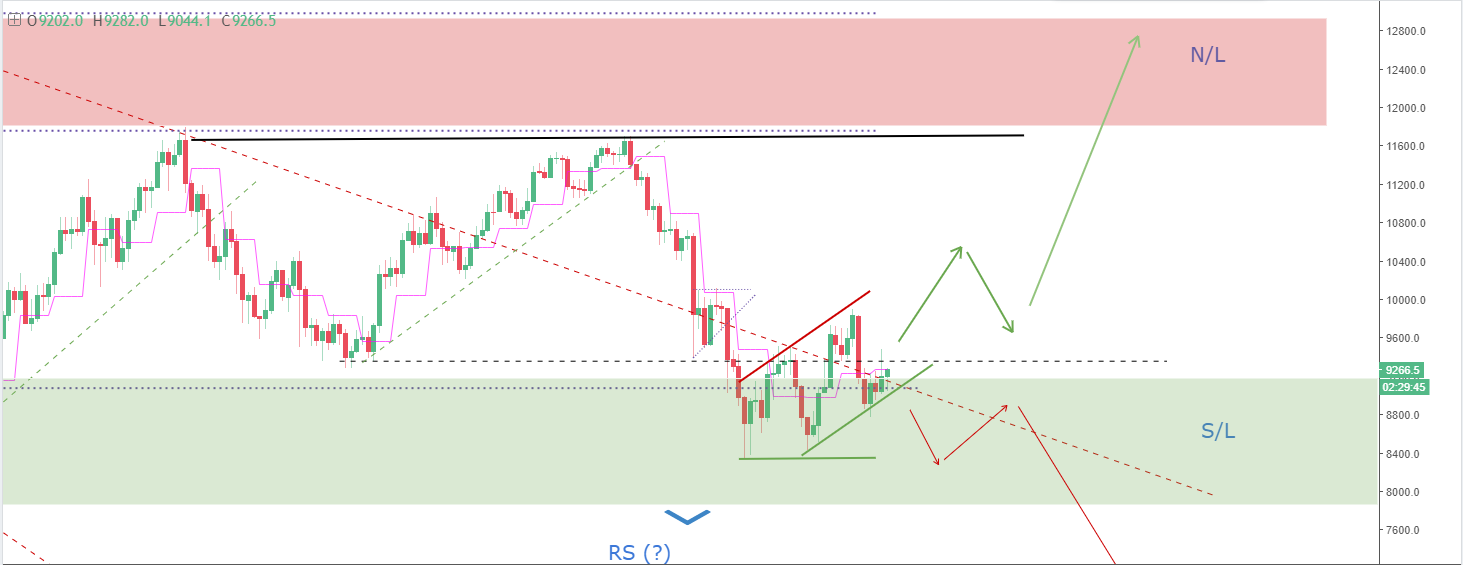
Although the price action is looking weak, it is making shortterm higher highs and higher lows (forming an ascending trading channel), however it is not yet convincing enough to avert the danger of further downside: i.e. it could end up forming an ascending wedge which could break to the downside.
Key Levels
Using the Bitfinex exchange prices:
Resistance: $10,000
Support: $8,400
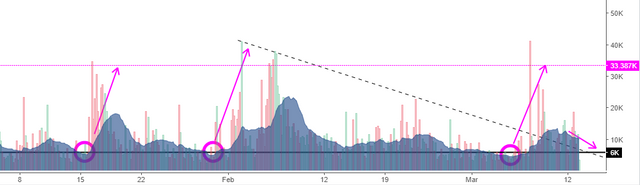
Volume
The average volume is rolling over as expected, making an orderly continued ascent in price (if there is one) more likely.
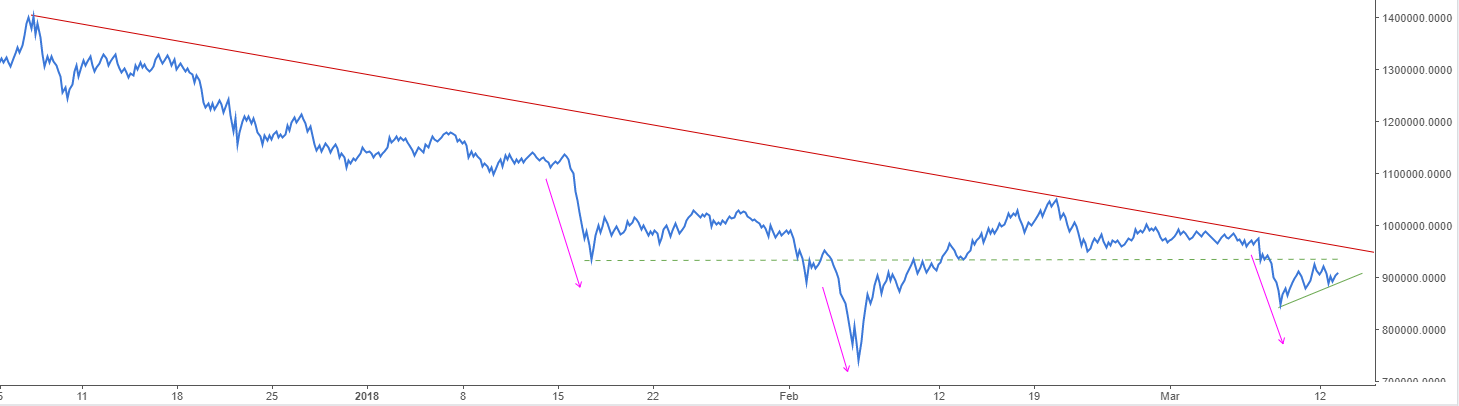
Not much change on the On-balance-volume indicator from yesterday. If the indicator can get above the previous horizontal support level (green dashed line) and then above the descending trend line (red solid line), then this would indicate buying pressure and support the recovery scenario.
Bias
I'm still favouring a recovery to the long side. The price has been acting weaker than I'd expected, but is clearly respecting the price support zone (between $8,000 and $9,000), so could be forming a solid base to project higher.
However, the price is vulnerable to a break of this recent ascending trading channel and the previous intermediate support level (@ $8,400), so keep eyes on this level if the price begins to break down.
Until tomorrow,
Bobby.