Bitcoin is on the Verge of a HUGE Breakout!!! FALLING WEDGE PATTERN
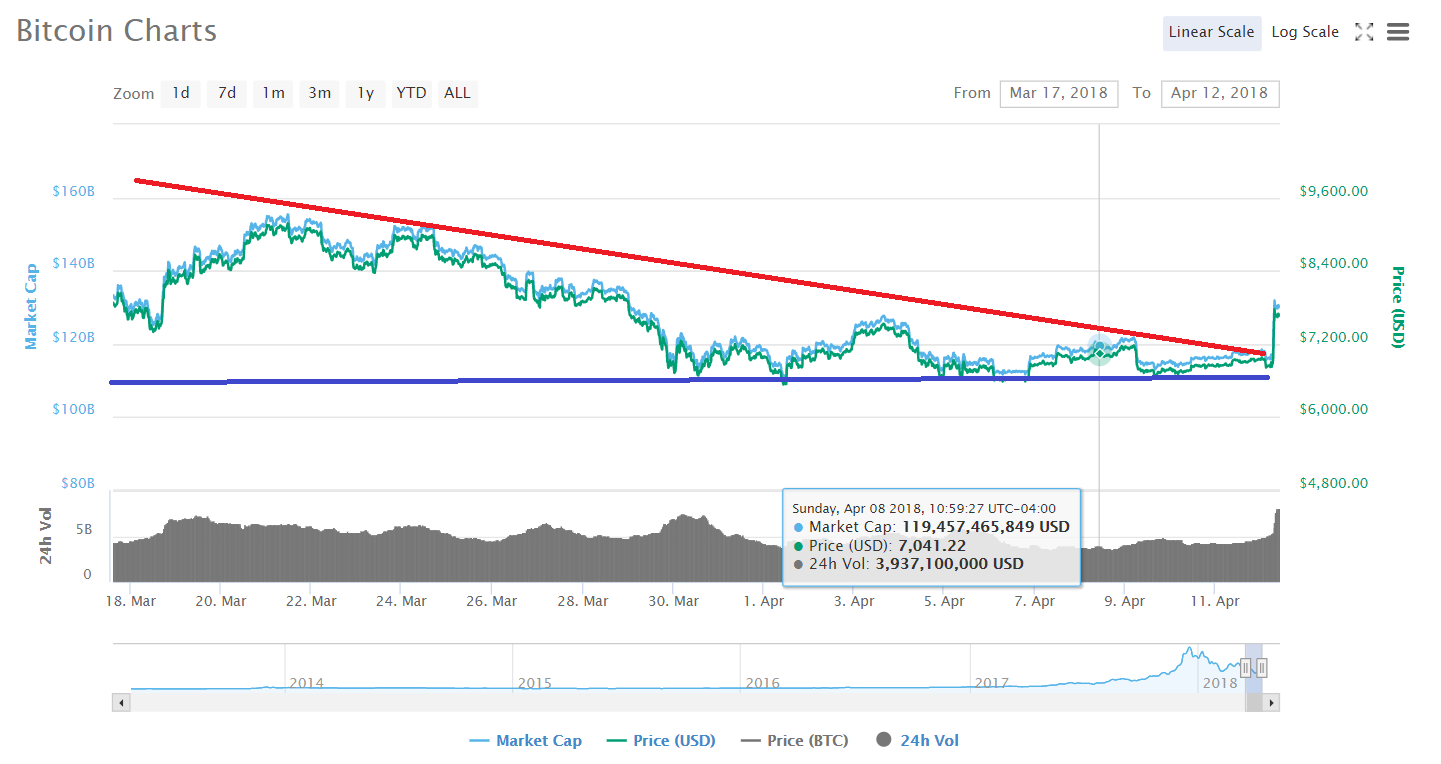
This is a classic technical analysis pattern that indicates a bullish pattern is on the way. The picture above shows the price and market cap of Bitcoin over the last few months up until present day. The two lines drawn on the chart represent the resistance and the support for the price. The red line shown on the graph is the resistance and the blue line is the support. The falling wedge pattern can be found when one realizes that the resistance and the support converge forming a wedge (the support stays horizontal). This pattern has long been an indicator in stocks of impending upsides and has also proven to be a great indicator with Bitcoin and other cryptocurrencies. As you can see at the end of the falling wedge, Bitcoin broke out over 10 percent in a day. In my eyes, this is only the beginning.
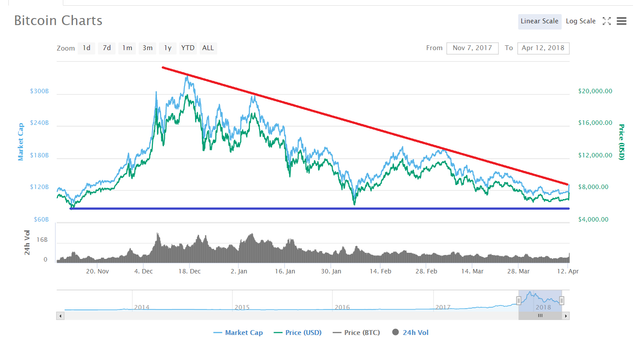
This picture shows Bitcoins price over the past year or so. Once again, seen with the help of lines for the resistance and support, there is also a falling wedge pattern. The falling wedge in this case is HUGE!!! Repeatedly, Bitcoin's price has bounced at roughly 6.5k. The resistance and the support is now converging indicating that a large bull run is impending. Do not get fooled by what the news is saying, technical analysis shows cryptos are ready for a BREAKOUT!!!
.png)
.png)
Sell low buy high amirite?
nope
Congratulations @davidb123! You received a personal award!
You can view your badges on your Steem Board and compare to others on the Steem Ranking
Do not miss the last post from @steemitboard:
Vote for @Steemitboard as a witness to get one more award and increased upvotes!
Thank you for the nice article https://9blz.com/falling-wedge-pattern/