How To Read Trading Charts For Beginners
When you first get started in the cryptocurrency world it can be very overwhelming with the amount of data and charts along with a million buzz words being thrown at you all at once. Until I got into cryptocurrency I had never done any stock trading or anything and I certainly had no idea how to read trading charts! Of course, I am still learning myself (there is a TON to learn!), but I will go over the very basics of how to read a few different types of trading charts you will encounter when you are starting out with cryptocurrency trading and even just hodling!
The Line Chart
A line chart is one of the most basic charts you will come across and it looks a lot like you may remember from high school math! These charts show the simple progression of a coin over time represented by a line. Many times you will see line charts with multiple different lines tracking different aspects like price and market share. These linear graphs give you a good general idea of what the coin has done in price over time. In the example below we look at a simple line graph from one of the most popular tracking sites CoinMarketcap.com.
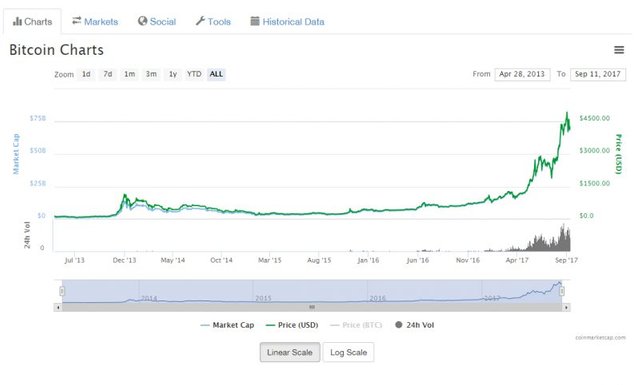
Here you can see in this line chart that they show you the price of Bitcoin in USD in green, Market Cap in light blue and then the 24hr volume in the grey at the bottom right corner. This is a pretty standard chart you will see. Of course the green line is the most important, as it is the price of Bitcoin, but Market Cap and volume are also very important and you can see how they correlate and follow each other.
Zoom Baby Zoom
An important feature of almost any trading chart is the "zoom" feature. In the Bitcoin chart above you see we have the zoom feature at the top left and it is set to "ALL" to show the entire lifetime of tracking. If we check another option like 1y (1 year) or 3m (3 months) we get the same type of graph but just zoomed in to give us more detail. This is super helpful to see different trends for the coin quickly. As you can see the charts for 3m and 1 day look quick different, but they have all the same data.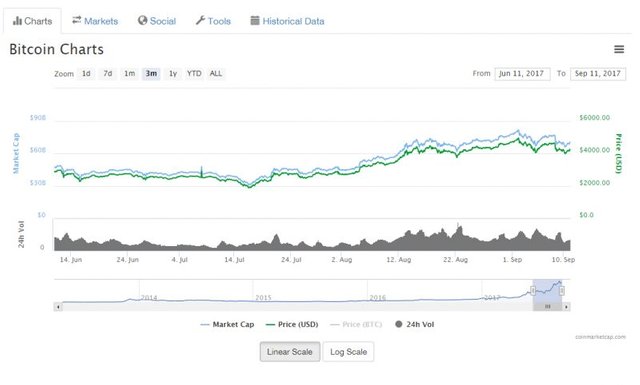
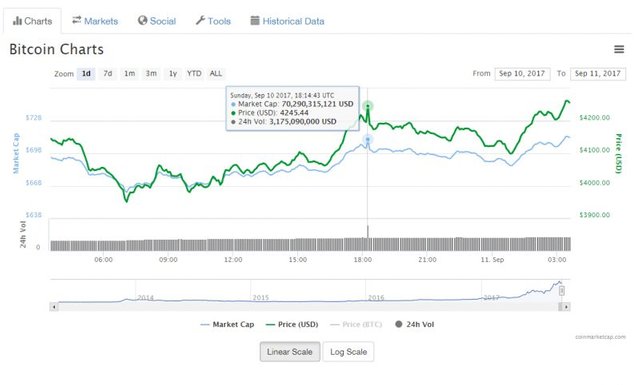
Another useful feature of most charts is the ability to hover over the line chart and get the data for that given period. As you can see in this 1 day chart I hovered over that quick spike in price and it gives me the exact data for that peak. While this is a good amount of data, most traders rely on a better type of chart called the candlestick chart.
The Traders Choice
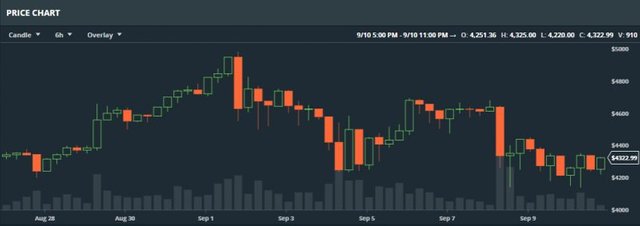
The candlestick chart is a more advanced trading chart and is what you will see on most exchange sites out there. It shows things like price, market cap, and volume with the zoom feature as well, but it also shows a lot more detail about the trading in any given period.
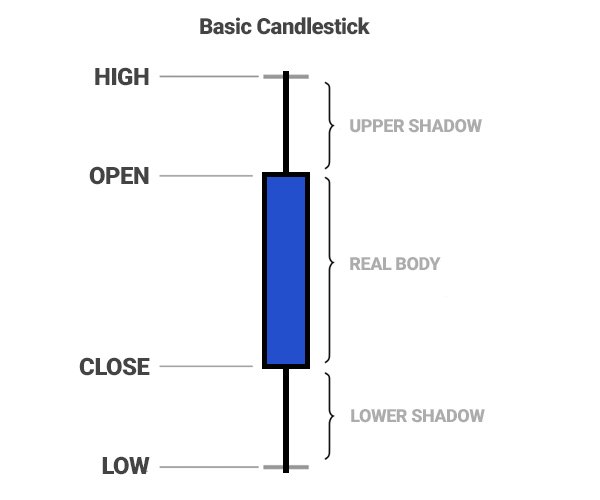
A "candle" will display the opening price, the lowest and highest price of the selected time-period along with the price it closed at. The "wick" or the lines at the top and bottom indicate the lowest and highest prices during the selected time.
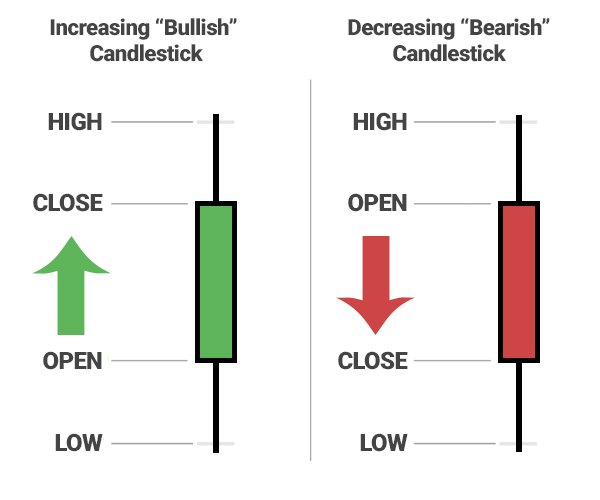
The color of the candle body indicates whether the closing price was higher than the opening price represented by a green bar or increasing up bar or lower than the opening price represented by a red bar or decreasing down bar. The green up bar can be considered "Bullish" and means it is on an uptrend. The red down bar means it is "Bearish and on a downtrend (check out my article on crypto terms for more). This type of chart is more useful for traders because it help them to do technical analysis and try to predict where the price will go next. While charts like this are good indicators, nothing is for certain in this crazy cryptoworld!
What To Do Now
This should give you a basic understanding of how to read trading charts and what all the numbers mean. Of course, you may come across some charts that are more complex or a bit different working, but for the most part they are very similar. My advice is to first start following the price of Bitcoin and your other favorite coins daily. Don't obsess over it, but just kinda keep track and this will get you more familiar with reading charts and looking at them.
All this information is great, but what can you really do with it? Well, personally, I don't do a lot of day trading, but using these charts for technical analysis can help you to see when it might be good to buy and when it might be good to sell. Technical analysis is a lot more advanced and something I will go over in a future article. Now that you are armed with some major chart reading knowledge, go forth my new friends and dive into some charts!
Nobody Can Chart The 'Stache!
![]()
For more fun original cryptocurrency content, check out my blog:
https://www.CryptoStache.com
This is exactly the kind of post I've been looking for. You sir are great Stache among Staches :)
Thank you so much for the useful information!
No problem, make sure to check out my blog too! https://www.cryptostache.com
This post recieved an upvote from minnowpond. If you would like to recieve upvotes from minnowpond on all your posts, simply FOLLOW @minnowpond
Great information, thank you for the post! This has been resteemed!
thanks! This one took me some time to get to!
Hey buddy great post I could use a bit more education on candle stick charts and how to read them. Do you get into using the fibonacci lines/tool or any of those other tools to further delve into the charts? That's totally over my head but always have been curious to understand how that potentially helps to anticipate what the market is going to do?
I have been doing a little technical analysis on a few of my investments, but nothing very advanced. I wanted this post to be very simple about how to just read them in general.
I will be working on some more advanced stuff like you mention later in the fall.
@originalworks
The @OriginalWorks bot has determined this post by @cryptostache to be original material and upvoted it!
To call @OriginalWorks, simply reply to any post with @originalworks or !originalworks in your message!
To nominate this post for the daily RESTEEM contest, upvote this comment! The user with the most upvotes on their @OriginalWorks comment will win!
For more information, Click Here!
@cryptostache got you a $1.27 @minnowbooster upgoat, nice! (Image: pixabay.com)
Want a boost? Click here to read more!
Awesome post i learned a lot from this.