Bitcoin update: RSI and Fibonacci supports hint at more red to come
Taking a break from Elliott waves, this post looks at two other useful tools for analysing the ongoing bitcoin correction: the relative strength index (RSI) and Fibonacci confluences.
Relative strength index
The RSI is a great tool for determining, among other things, tops and bottoms. For those who aren’t familiar, roughly speaking, when the RSI is over 70 or below 30, price will be looking to move down or up, respectively. Chart 1 (daily price for bitcoin) shows that RSI has been pretty low for most of this month, nearly reaching 25 on 13 June. Normally this would be further evidence of an impending reversal. However, I don’t think we’re quite there yet. Looking back to the last cycle-level correction in 2014, the daily RSI plunged as low as 17.5 (the yellow line on the chart), with a further two contacts around the 20 level.
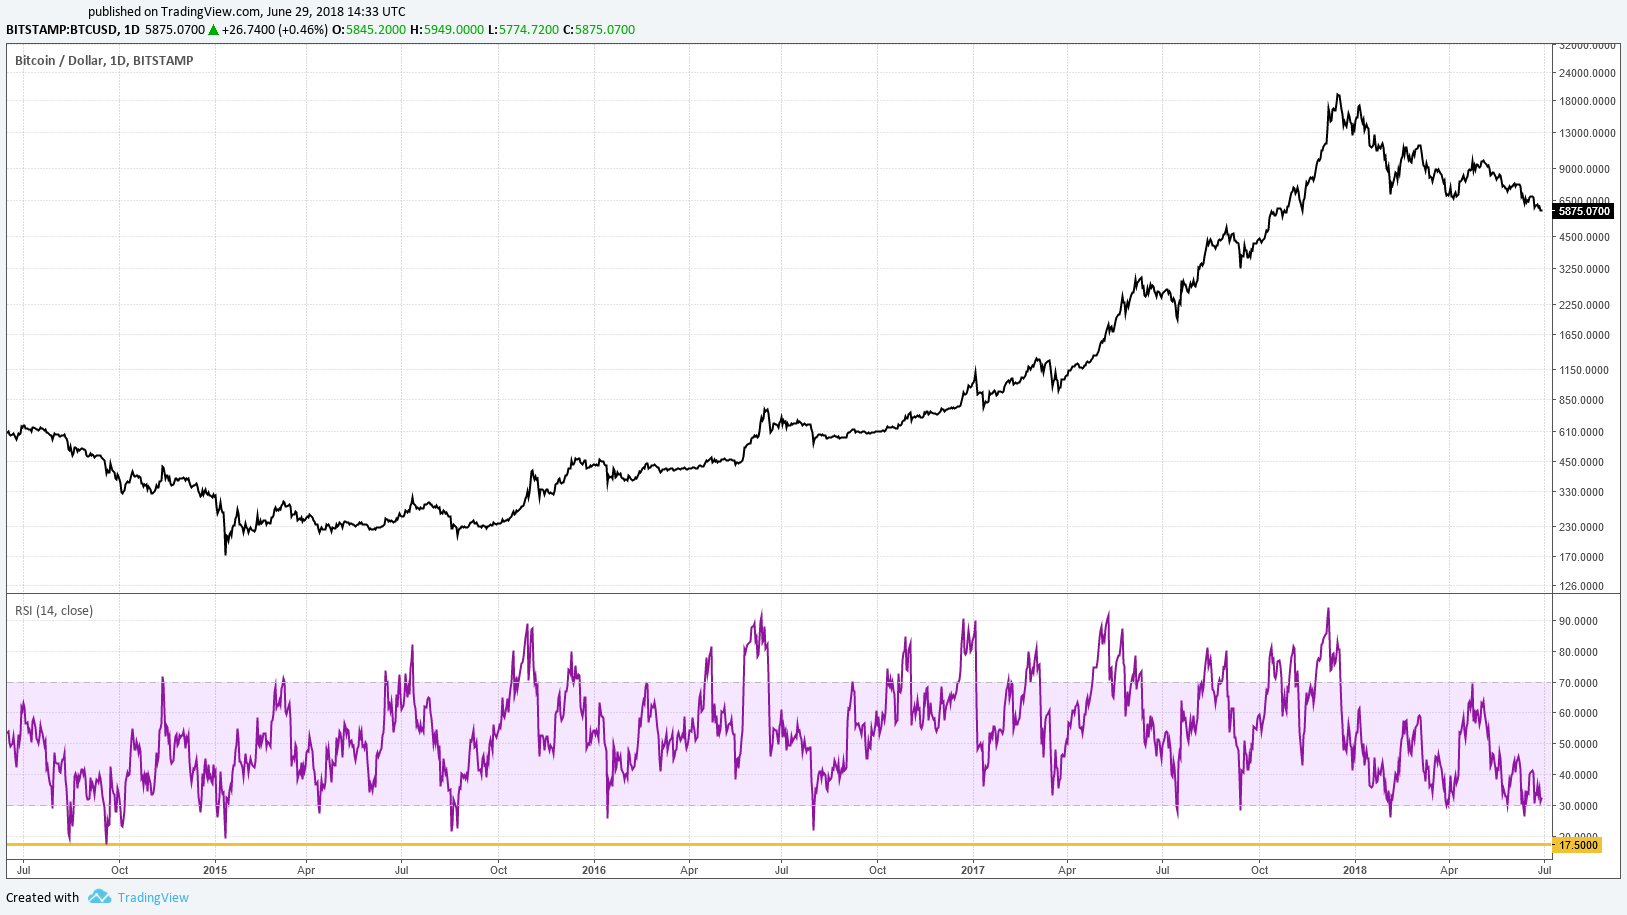
Chart 1 (click to enlarge). Daily bitcoin chart with RSI.
The RSI on the weekly chart provides even stronger evidence that there is room for more downward movement. Chart 2 shows RSI on the weekly chart, currently sitting at around 40. Note that during depths of the 2014 correction, RSI briefly dipped below 30. (Both the current level and the historic low are circled in yellow on the chart). Given that this correction, like in 2014, is also at cycle level (see my long-term wave count for bitcoin), there’s a good chance the weekly RSI will pierce the critical threshold of 30, representing a proper reset before a trend reversal.

Chart 2 (click to enlarge). Weekly bitcoin chart with RSI.
Fibonacci supports
Another important aspect to have in mind during any downward trend is the support levels that might constitute inflection points or even the bottom itself. Fibonacci levels and confluences provide a useful tool for determining supports.
Chart 3 shows three series based on the three main Fibonacci levels (0.382, 0.5 and 0.618) plus the 1.618 extension, based on the top that occurred around USD 7,600, starting from USD 3,000 (green), USD 1,850 (purple) and USD 750 (pink).
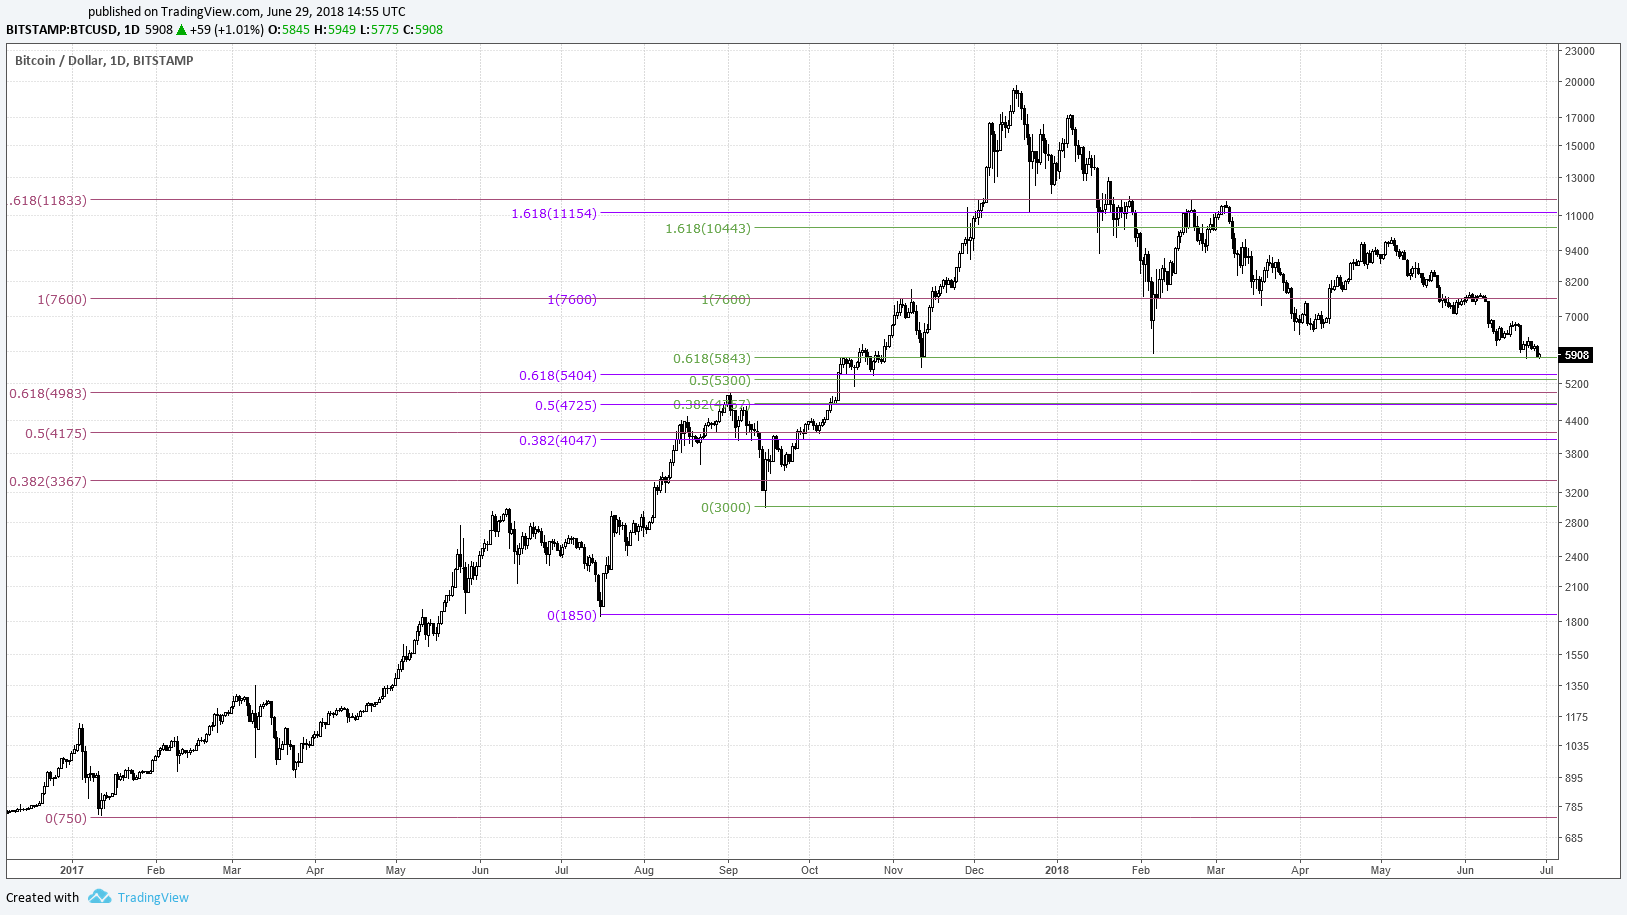
Chart 3 (click to enlarge). Fibonacci lines based on the top around USD 7,600.
Some observations from these Fibonacci levels:
- It’s striking how well the 1.618 extensions define the double top formation that occurred in February and March 2018, as well as the preceding chop in January.
- Also note how, at the time of writing, the bitcoin price is perched precariously on the green 0.618 level around USD 5,900.
There are three confluence levels that may prove useful:
- USD 5,300–5,400 is a confluence between the green and purple series, tested as support in October 2017.
- USD 4,725–4,775 is also a confluence of the green and purple series, tested as support in September 2017 and now turned resistance. This zone could even extend to the pink 0.618 level that marks the top of USD 5,000 in September 2017.
- USD 4,050–4,175 is a confluence of the purple and pink series, which served as repeated support and resistance in 2017.
Chart 4 shows the exercise repeated with the same starting points for the top that occurred around USD 5,000. Once again, note how well the 1.618 extensions determine future price action in the correction this year and, in the case of the extension of the red series, even the 1.618 top itself.

Chart 4 (click to enlarge). Fibonacci lines based on the top at USD 5,000.
Once again, we can make out three confluences:
- Confluence of blue and orange around USD 3,750–3,800.
- Confluence of red and orange around USD 3,375–3,425.
- Confluence of orange and blue around USD 3,000–3,050, possibly with a third confluence of the red series at USD 2,875.
All six Fibonacci confluence zones (three from the USD 7,600 top and three from the USD 5,000 top) are shown in Chart 5, in addition to the USD 5,000 top, which acts as a major psychological support.
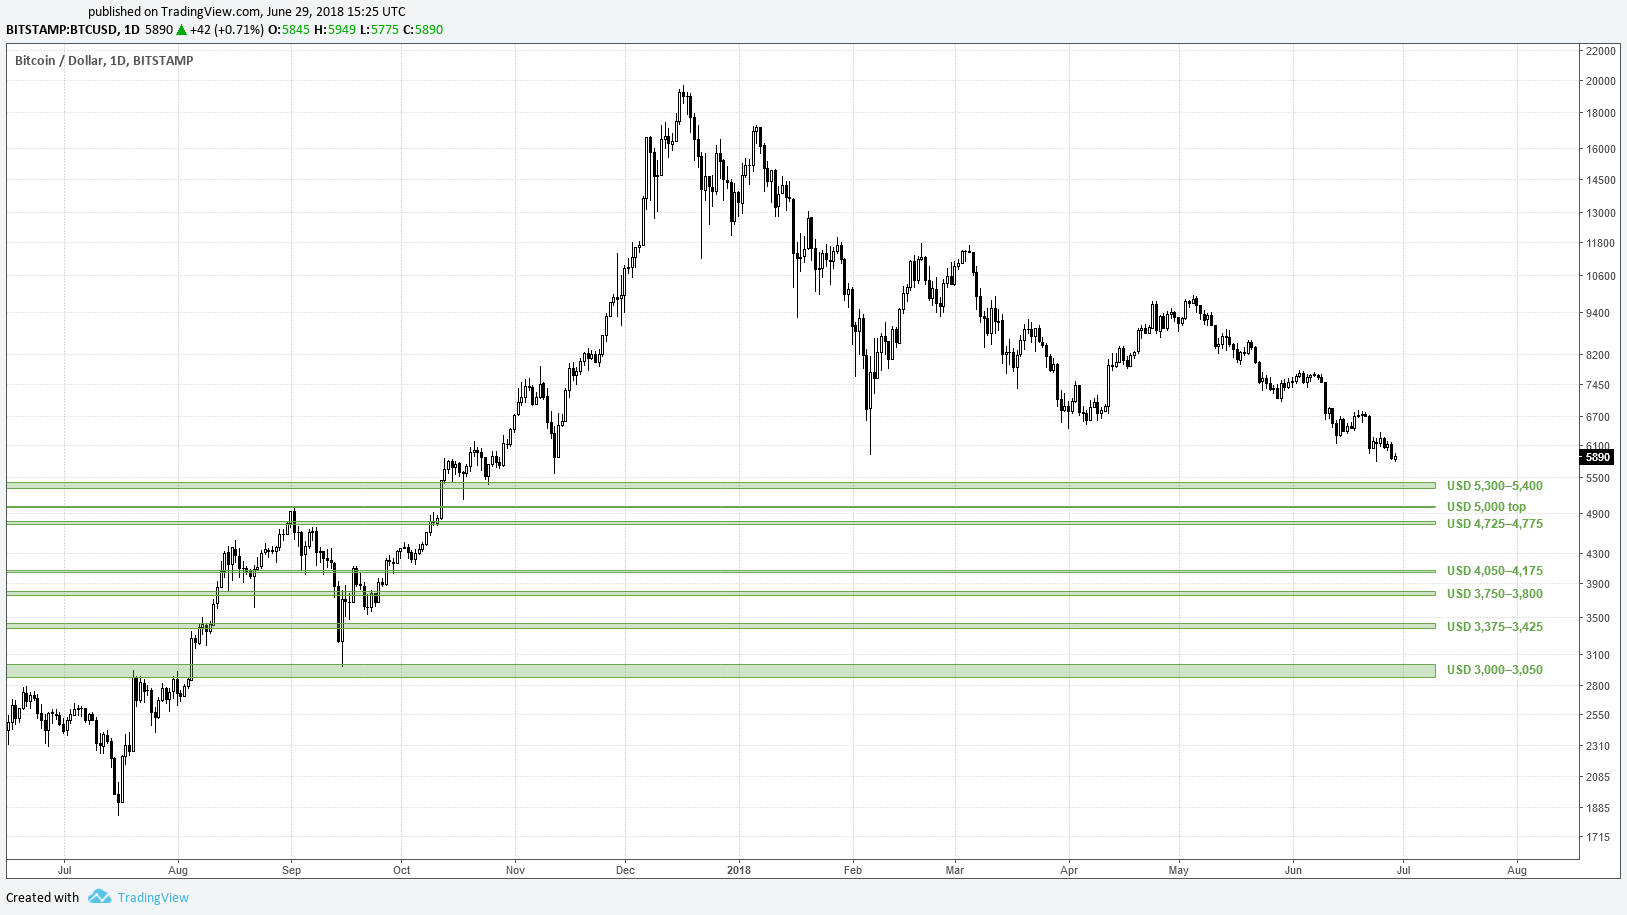
Chart 5 (click to enlarge). Fibonacci confluence supports.
Mapping the way down
If the historic levels of daily and weekly RSI during the 2014 correction show there is still plenty room for downward movement, the Fibonacci confluence zones give us a map of some landmarks to look out for on the journey down. Let’s see how it goes and just how far we get.
Disclaimer: I am not a financial adviser. Nothing in this post should be taken as financial advice. All content is provided for information purposes only.
All text copyright @cryptolaidlaw 2018. All rights reserved.
All figures are approximate.