A long-term wave count for bitcoin
I’ve been puzzling over a long-term count for bitcoin for a while now, wanting to put some thoughts down in a blog. The ongoing correction provides a good opportunity to reflect on the longer-term trend of bitcoin. Doing so can give a sense of perspective on the current correction, an awareness of where the bottom might lie and an idea of what we can expect when the correction is over.
The cycle trend
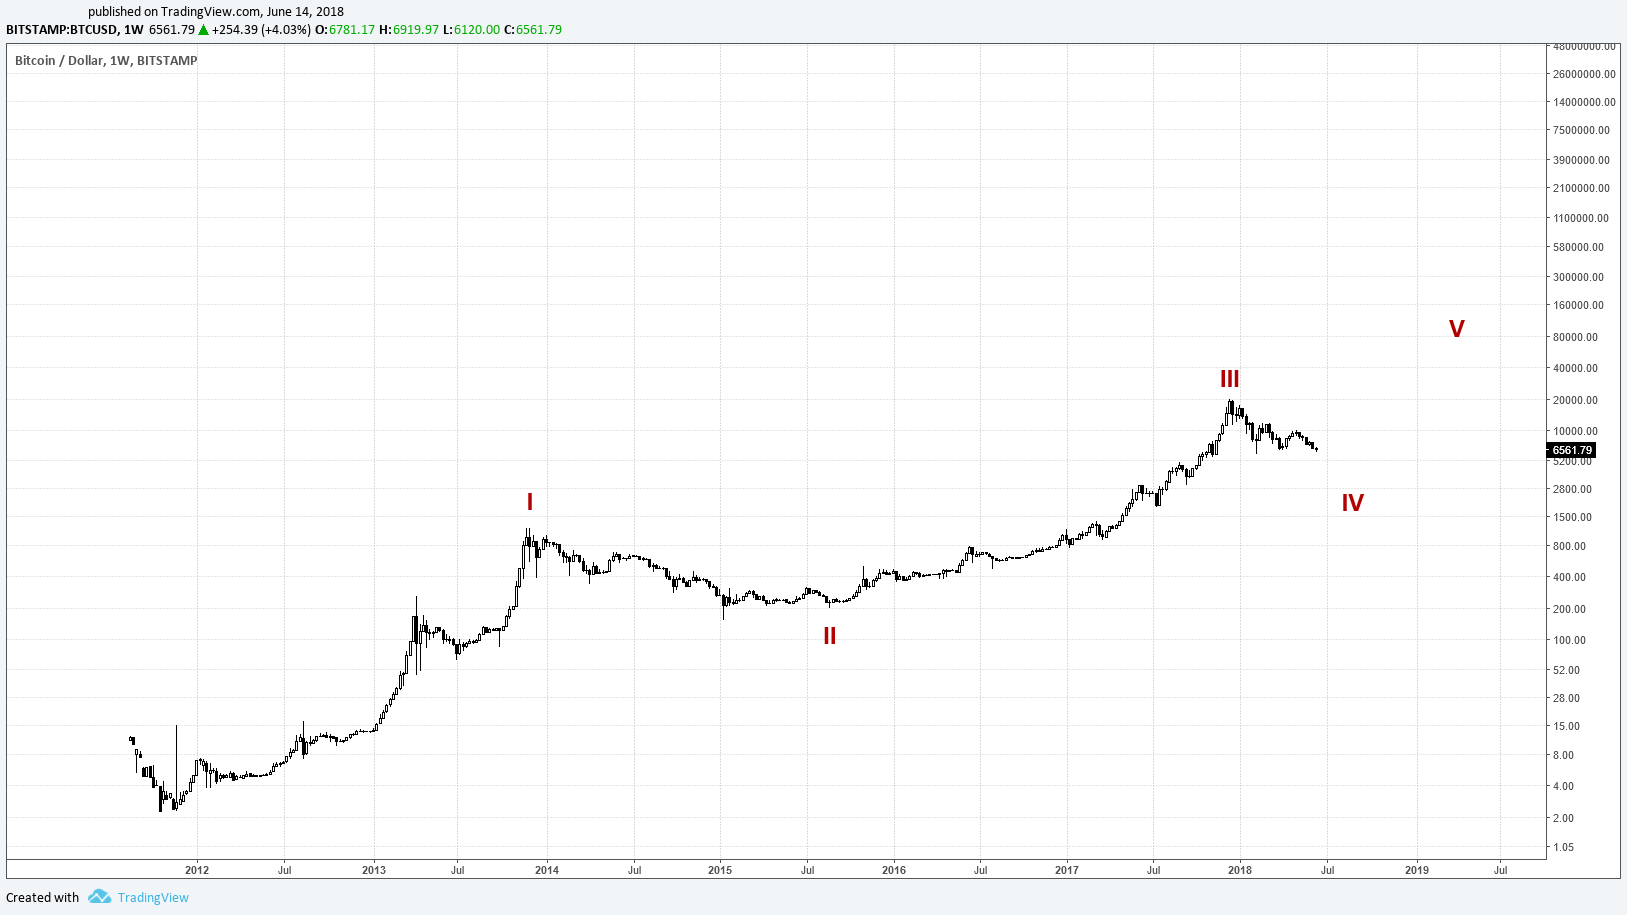
Let’s begin by pinning down some markers at the highest degree of trend, namely the cycle dating back to bitcoin’s genesis in 2009. Looking at the long-term charts since 2011, the one event that sticks out most clearly is the long correction that began at the turn of 2014. Its duration (around 20 months) and depth (85 percent) are quite unlike any other on the chart. This gives strong grounds for placing this correction as wave II of the impulse sequence. As Chart 1 shows, this would make the preceding high the top of wave I, the recent all-time high at the end of 2017 the top of wave III and the current correction wave IV. Let’s take a closer look at each of the waves.
Chart 1. Bitcoin cycle waves.
Cycle wave I: Genesis
Although the charts only go back to 2011, information on previous price highs is available elsewhere online. From this information, it is possible to posit the following primary motive waves for cycle wave 1:
- Primary wave 1 ending at the high of USD 30 in July 2011
- Primary wave 3 ending at the high of USD 260 in April 2013
- Primary wave 5 ending at the high of USD 1,200 in December 2013, marking the end of cycle wave I and the onset of bitcoin’s first cycle-degree correction (wave II in Chart 1).
Cycle wave II: The 2014 correction
At first sight, the 2014 correction that began after the high of USD 1,200 in December 2013, appears to bottom around USD 150 in January 2015. However, upon closer inspection of the chart, the interval from January to August 2015 doesn’t really look like an impulse sequence. Accordingly, Chart 2 shows a count in which this is interpreted as an expanding triangle that forms the Z wave of a complex WXYXZ correction.
Chart 2. Primary and intermediate count for cycle wave II.
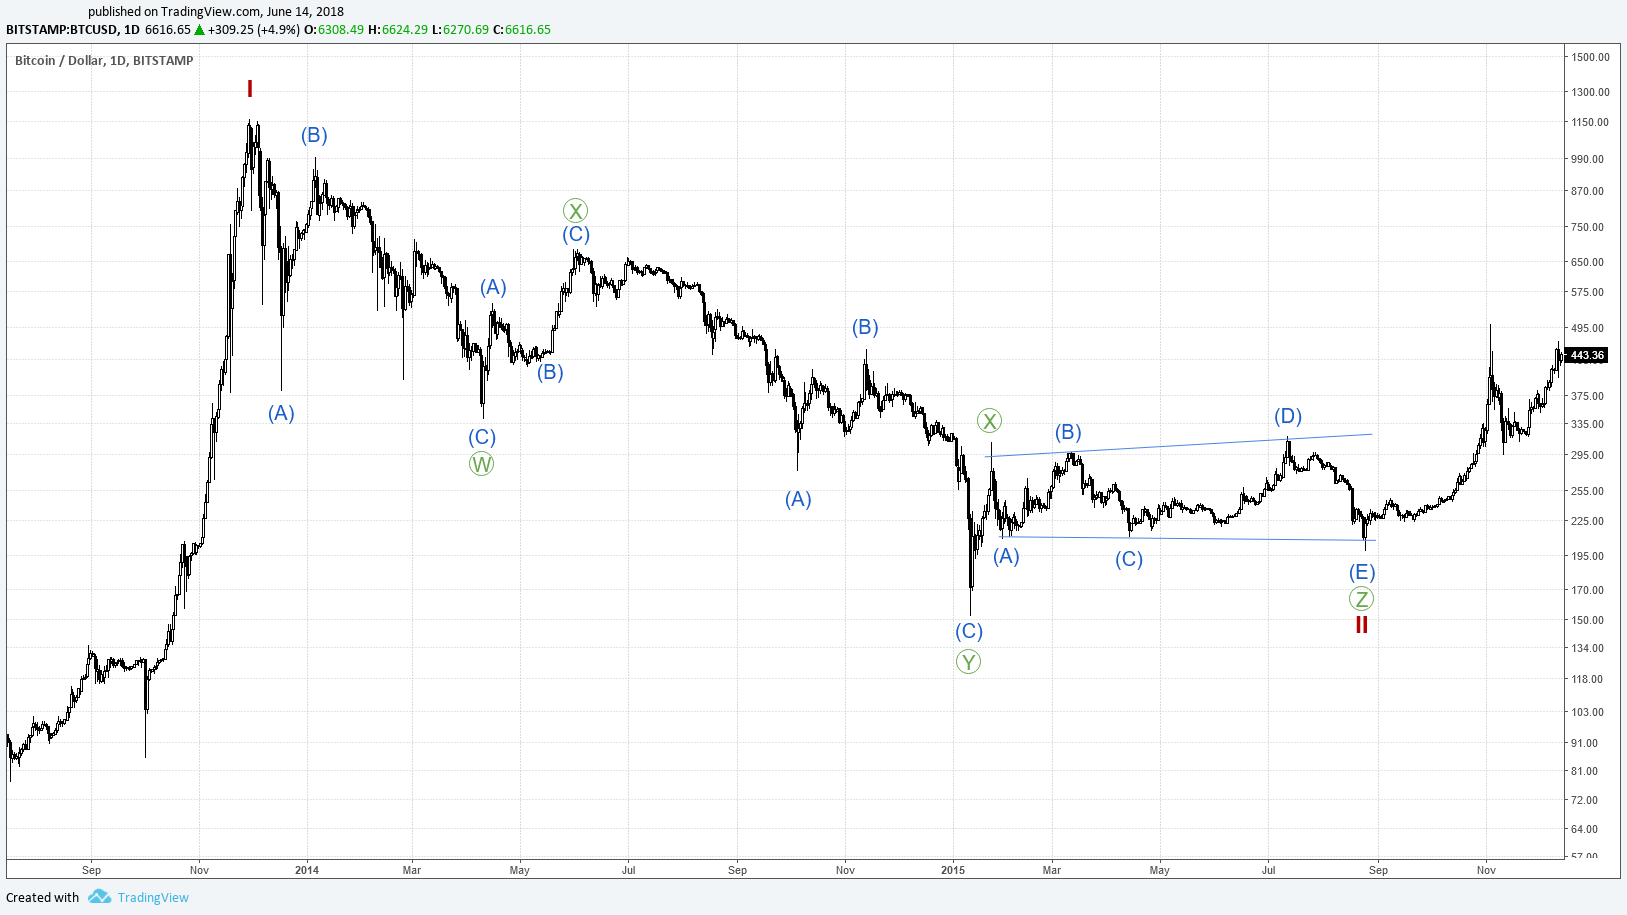
This gives an orthodox bottom for cycle wave II somewhere in the region of USD 160 (Bitfinex chart) and USD 200 (Bitstamp chart), representing a total retracement of around 85 percent.
Cycle wave III
The long impulse sequence that follows the 2014 correction is tricky to count for a number of reasons, not least the prolonged channel between November 2015 and March 2017. In all likelihood, there are a number of different solutions. Chart 3 shows one of them, based on a first wave that is extended in time, followed by two similar impulses that form primary waves 3 and 5 in the sequence.
Chart 3. A solution for the primary and intermediate count of cycle wave III.
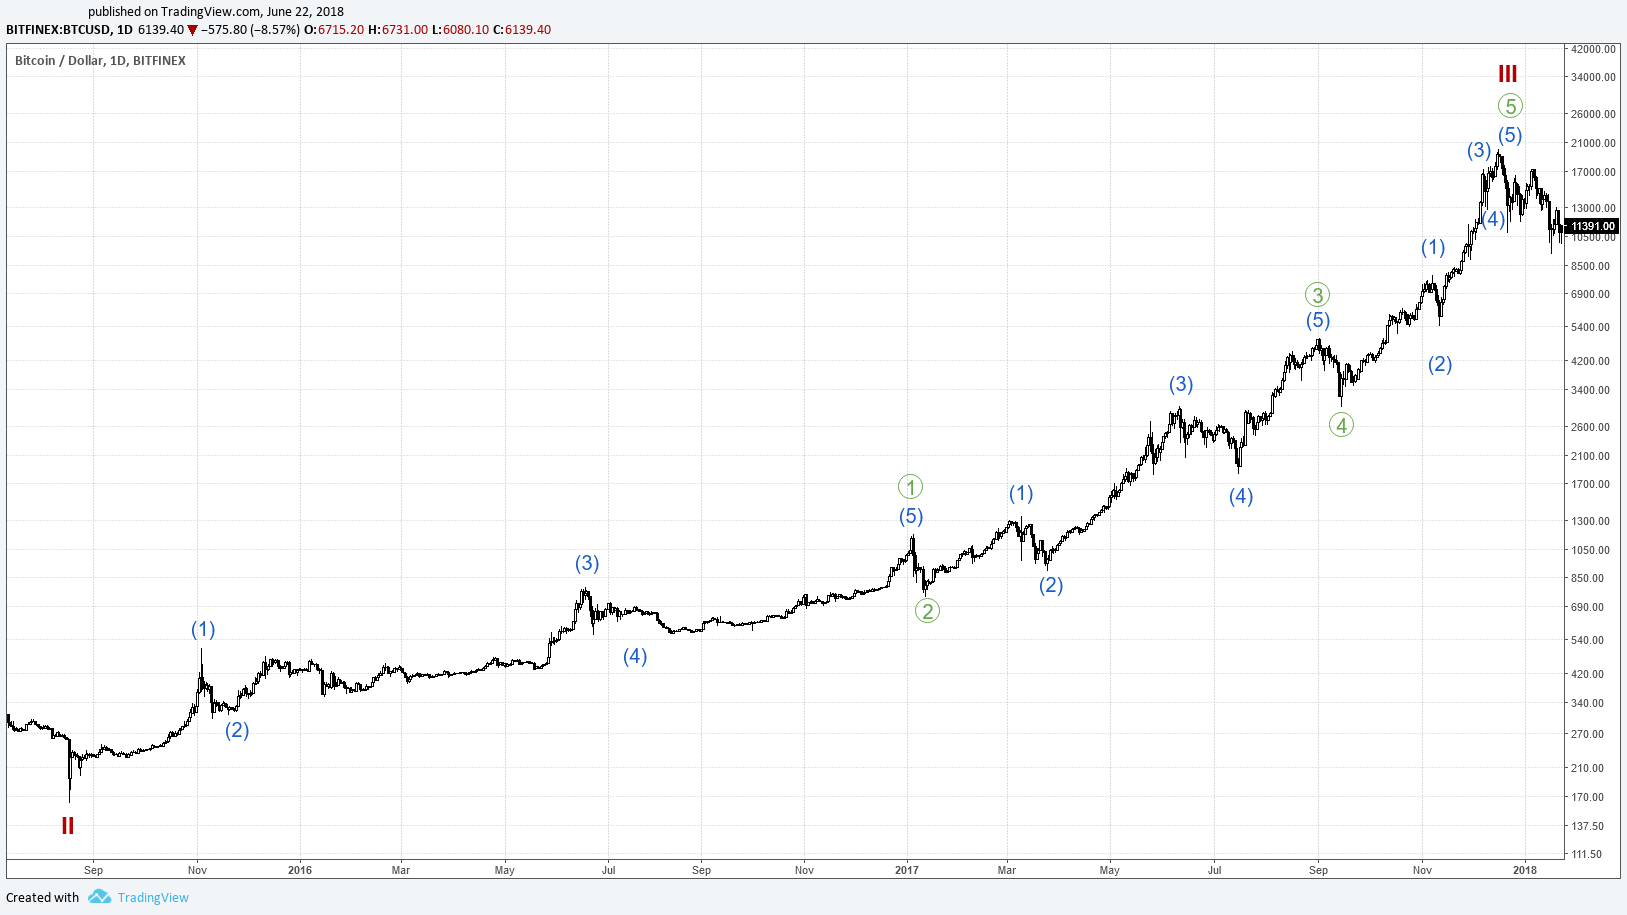
The lengths and durations of the primary waves in Chart 3 are also shown in the table below.
| Primary wave | Start | Stop | Duration | Change |
|---|---|---|---|---|
| 1 | 160 | 1,150 | 17 months | 620% |
| 2 | 1,150 | 750 | 7 days | –34% |
| 3 | 750 | 5,000 | 7.5 months | 565% |
| 4 | 5,000 | 3,000 | 13 days | –40% |
| 5 | 3,000 | 19,600 | 3 months | 555% |
Cycle wave IV: The 2018 correction
I’ve already published a count for the 2018 correction in a previous post, which is reproduced for convenience as Chart 4 below.
Chart 4. Proposed count for the 2018 correction (cycle wave IV).
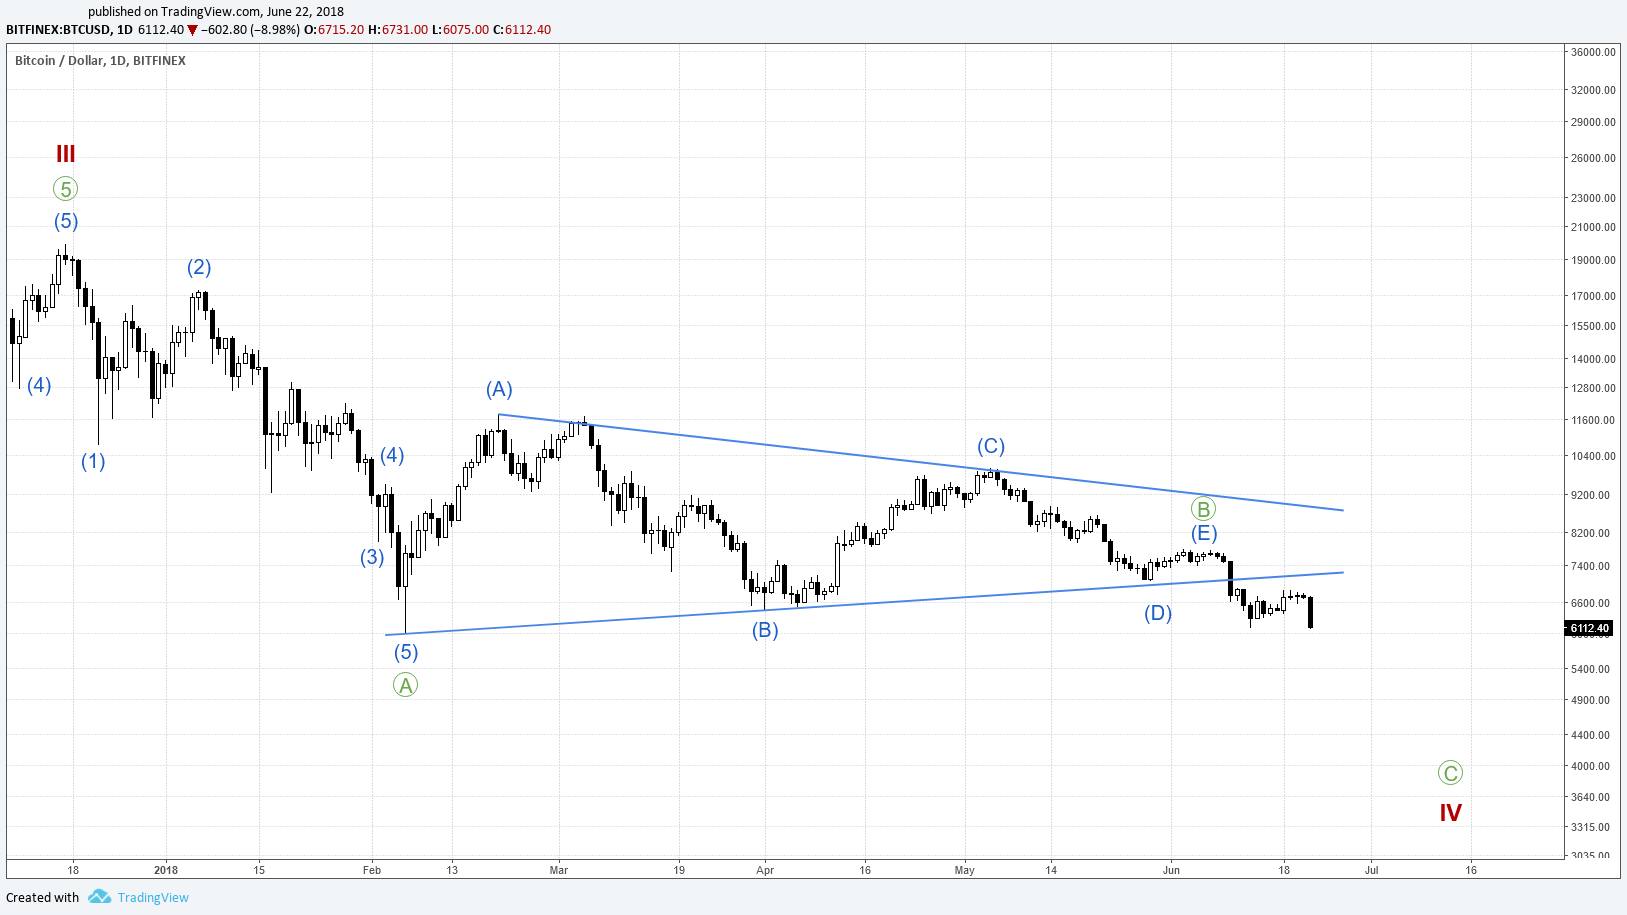
This count still stands, even though wave E was rather short. However, in light of the count for cycle wave III proposed in Chart 3 and Elliott’s guideline that fourth wave corrections often bottom within the region travelled by the fourth wave of wave three of the higher degree of trend, the bottom of cycle wave IV could lie in the region of USD 3–5k. (Note that 0.618 of the 70 percent retracement of primary wave A would give a bottom around 4.3k).
Cycle wave V: After the correction
This leads us to the big question: based on the count above, what might happen when the correction is over? The most straightforward approach here (textbook Elliott theory) would be to join the bottom of wave II and the hypothetical bottom of IV and then draw a parallel line through the top of wave III to create a price channel. Chart 5 shows a Fibonacci channel based on this approach. Note how many of the highs and lows respect the channel levels.
Chart 5. Fibonacci channel based on a hypothetical bottom of cycle wave IV.
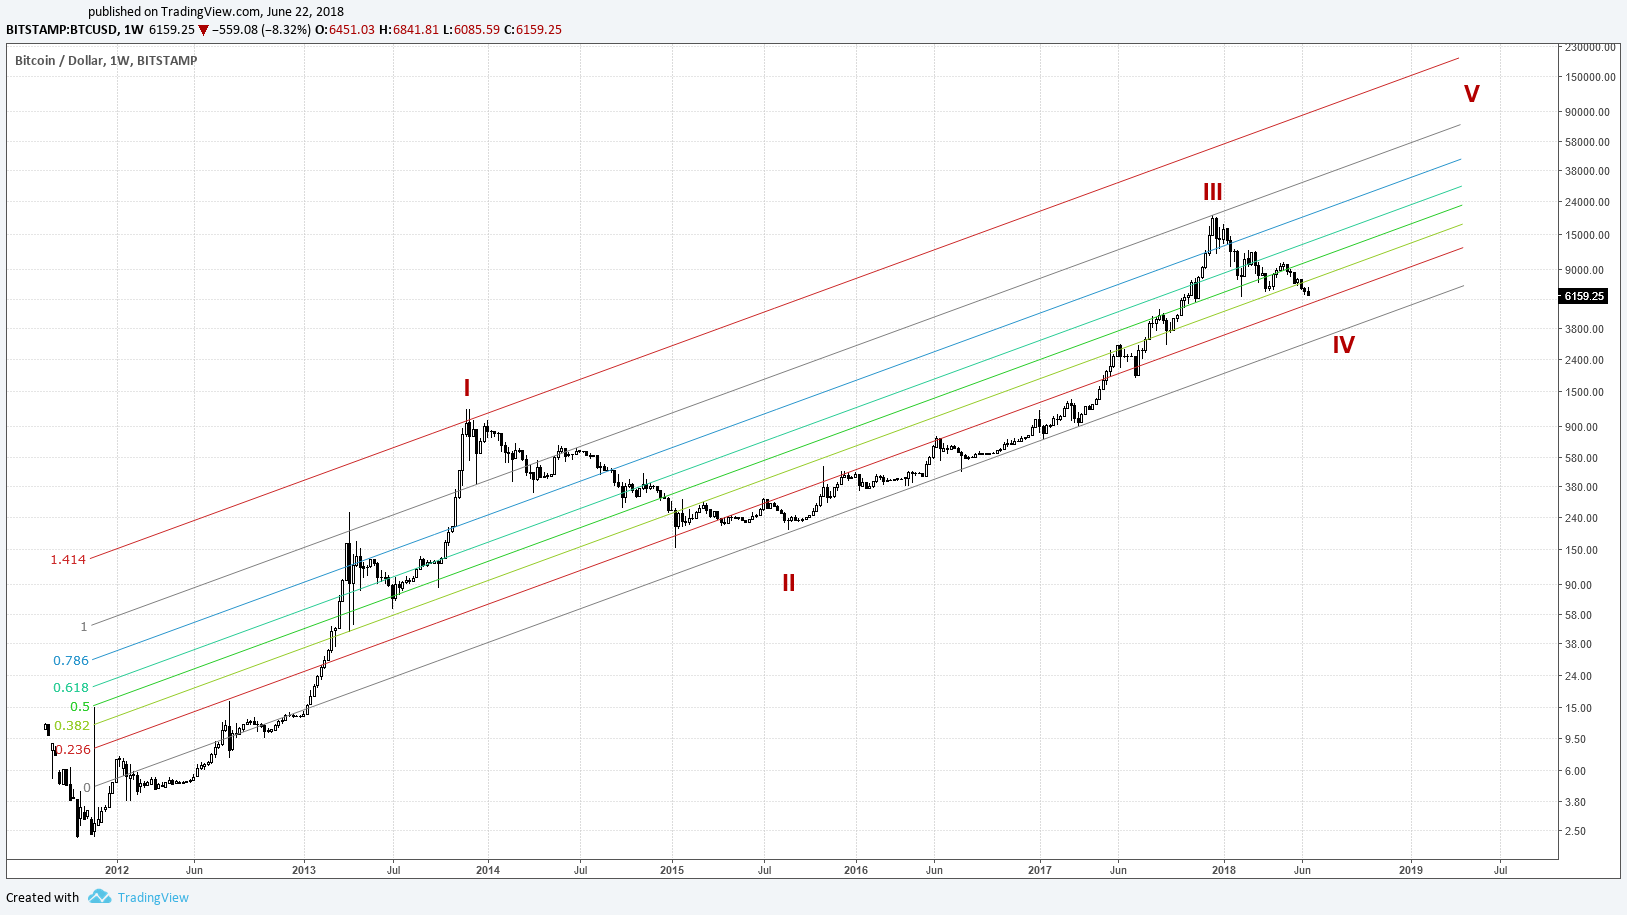
This technique, which can be refined by redrawing the Fibonacci channel when we have the bottom of cycle wave IV gives an idea of some of the key levels to look out for in cycle wave V.
Innovators, early adopters, majorities and laggards
Let us conclude this analysis by taking a step back and thinking about how all this might reflect patterns of collective human behaviour based on the theory of the diffusion of innovations. The theory identifies five categories of adopters:
- Innovators
- Early adopters
- Early majority
- Late majority
- Laggards
In terms of the adoption of the underlying technology of bitcoin and cryptocurrencies in general, we are nowhere near majority stage yet. What we may have seen in wave I of the cycle, is the innovators (e.g. the famous bitcoin pizza). What we may have witnessed in cycle wave III is the early adopters of crypto (e.g. the tentative use of crypto to pay for everything from everyday purchases such as coffee to taxes and property). Cycle wave V could then pave the way for early majority adoption, accompanied by a renewed frenzy of speculation, helped along by institutional investment.
This fits nicely with the chart’s suggestion of one more primary impulse sequence before the end of the cycle. After cycle wave V, a sizeable correction would ensue, allowing the underlying technology to be appraised in more sober terms. This would lay the ground for the late majority and laggards in the beginnings of a new cycle.
Disclaimer: I am not a financial adviser. Nothing in this post should be taken as financial advice. All content is provided for information purposes only.
All text copyright @cryptolaidlaw 2018. All rights reserved.
Upvoted, resteemed and followed. Lets see how it goes.
Thanks, much appreciated :)