Bitcoin chart analysis & price predictions
Welcome to condoriano‘s simple cryptocurrency market analysis.
Today we‘re going to look at the most mainstream cryptocurrency, also known as „Bitcoin“.
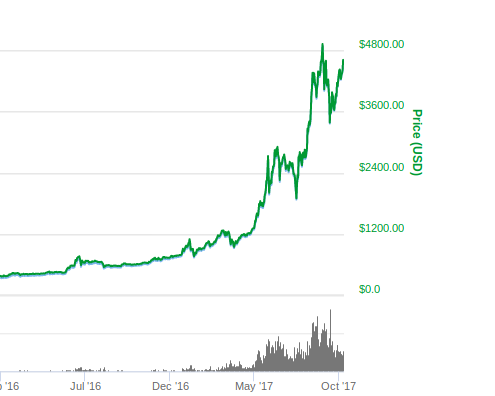
First lets take a look at the naked BTC chart. (Source: „coinmarketcap.com“)
Naked chart
Whats the first thing we see? Bitcoin has gained alot of momentum over the last few months. We can see, that its a bullish(gaining) market.
Its price has risen from the beginning of this year at about 970$ per BTC to amazing 4.500$ per BTC!!!
That makes more than 400%!!!
Higher highs, higher lows
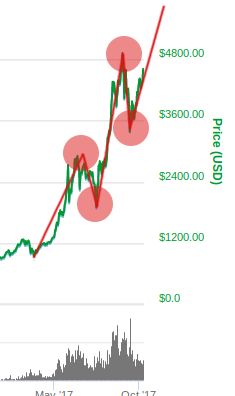
Ok, we know that the market is bullish and because of that i‘ve pointed out the higher highs/lows created by BTC, by drawing red circles on the chart.
If a price creates higher highs and higher lows, then its a very significant sign for the price to go further up and create other higher highs/lows in the future.
-If anybody wants to buy BTC‘s, i advise you to enter the market AFTER a higher low has been created. -If you want to sell your Bitcoins (which i dont advise to do in a bullish market), you should sell your Bitcoins AFTER a higher high has been created.
Resistance/Support lines
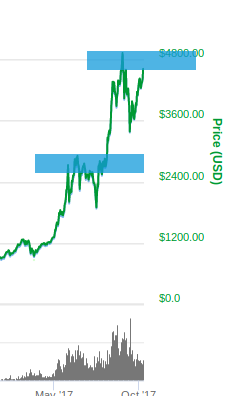
Now we are going to learn about resistance/support lines. Here im pointing out to you two very segnificant resistance/support lines on the BTC chart.
As you can see the price in the past has not broken the first resistance line by the very first attempt.
The first resistance line was born, when the price created a higher high.
Then the price went lower and created a higher low, thus creating a support line, which i did not point out, because its not relevant to us.
Then the price went back up again and struggeled to break the first resistance line. Once the first resistance line has been broken, it became a support line.
After the break occured, the price went high up, just to create another higher high, thus creating the second resistance line.
Afterwards BTC‘s price created the next higher low, just to rise back up again, to reach the resistance level it created beforehand.
As we know from our first resistance line, the price will struggle to break trough, but if the break happens, bitcoins price will go to the moon, eventually creating the next higher high and so forth.
What to keep an eye on
Now what happens, if the prise will look like its heading back down again, not beeing able to break the second resistance line?
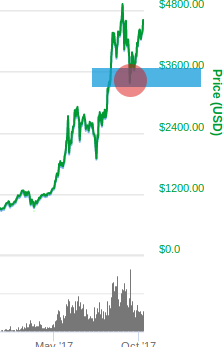
If thats the case, then we must keep an eye on previous Higher low! (Pointed out by the red circle and the blue bar)
Why? Because when this higher low has been created, a new support line has been born!
As long as this support line has not been broken by the price, we will be in a bullish market!
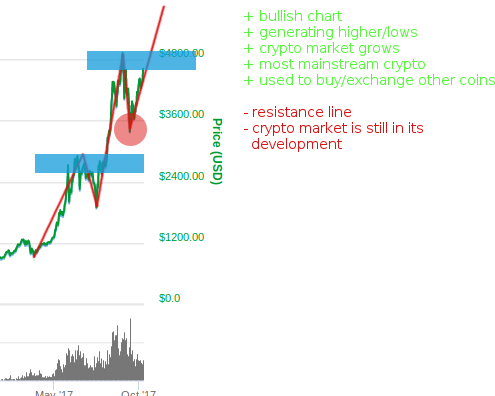
Summary of BTC‘s chart anaysis
BTC's price prediction
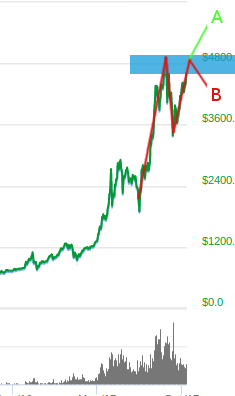
Right now there are two possible options for bitcoins price.
Option A: The price breaks the resistance line and goes further up.
Option B: The price does not break the resistance line and goes down to the support line created by the last higher low.
My opinion: I think Bitcoin‘s price will very lickely go further up, creating the next higher high, after that the price may consilidate creating new buy/sell options for traders.

Congratulations @condoriano! You received a personal award!
You can view your badges on your Steem Board and compare to others on the Steem Ranking
Do not miss the last post from @steemitboard:
Vote for @Steemitboard as a witness to get one more award and increased upvotes!